
Trợ giúp
Tất cả biểu đồ
"Tất cả biểu đồ" cho thấy danh sách hiện tại như là một băng đồ họa được xoay quanh theo thứ tự sắp xếp được chọn. Trên máy tính để bàn trên băng có bảng xếp hạng, khung thời gian chung, khoảng thời gian sắp xếp và thiết lập chữ ký, giá trị và màu sắc. Phiên bản di động sử dụng bảng nhỏ gọn riêng. Các bản đồ tải lên giữ lại ánh sáng và hình ảnh khi sắp xếp lại, và tương tác với đồ họa tạm thời đặt sắp xếp lại.
Nội dung có trong mục
- Điều gì khiến "Tất cả biểu đồ" khác với chế độ "Biểu đồ đã chọn", mạng lưới được lưu giữ và chế độ đồng xu duy nhất.
- Làm thế nào để chuyển đổi "Biểu đồ đã chọn" và "Tất cả biểu đồ" vào bảng điều khiển trên.
- Làm thế nào bảng phân loại được xây dựng từ các métrics được bật trong danh sách hiện tại và làm thế nào các click lặp lại thay đổi hướng, chế độ tuyệt đối hoặc phân loại nhóm.
- How to choose the shared timeframe with the header button and hotkeys.
- Như bản cập nhật tự động, tùy chọn "Hàn tay" và nút cập nhật điều khiển việc thay đổi đồ thị.
- Làm thế nào để bảng giá trị hiển thị các métrics trên mỗi biểu đồ và làm thế nào để ẩn bảng phân loại, chữ ký hoặc các tùy chọn riêng lẻ trong bảng sáu, thay đổi màu sắc của chúng và loại bỏ các định nghĩa lại.
- Tại sao việc thay đổi cách phân loại bằng tay lại chuyển sang biểu đồ đầu tiên, và việc tự động chuyển đổi lại lại lại giữ lại đồng xu và vị trí xem được chọn.
- Tại sao việc xoay, nhấn, vẽ và làm việc với các yếu tố biểu đồ tạm thời cho thấy trạng thái "Họ nghỉ" và chặn việc chuyển đổi.
- Làm thế nào để di chuyển qua các miếng miếng miếng, các khối miếng nổi và các phím Home, End, Page Up và Page Down.
- Như biểu đồ được chọn được sử dụng khi quay trở lại chế độ "Biểu đồ đã chọn".
- Làm thế nào bảng điều khiển di động điều khiển TF, métrics, chế độ phân loại, bản cập nhật tay, số lượng biểu đồ, chữ ký, khả năng hiển thị và màu sắc của các tùy chọn.
- Làm thế nào để một demo ẩn danh hoạt động: P₂₄ giảm, cập nhật mỗi 10 giây, mạng lên đến 3x3 trên máy tính để bàn và thời gian khởi động 5m trên điện thoại di động.
Màn hình và điều khiển chính
- Các chuyển đổi trên bảng điều khiển trên trong phiên bản cho PC: các gợi ý "Tất cả biểu đồ" và "Biểu đồ đã chọn" giải thích hành động hiện tại.
- Phanele phân loại trên đồ thị: nút các metric được bật, hướng hoạt động, chế độ tuyệt đối và quy trình phân loại nhóm.
- nút khung thời gian chung: áp dụng một khung thời gian cho tất cả các biểu đồ của chế độ này.
- Chọn khoảng thời gian cập nhật: cho biết liệu các biểu đồ sẽ tự động hoặc chỉ được cập nhật bằng tay.
- nút cập nhật tay: xuất hiện khi khoảng "Hàn tay" và áp dụng phân loại hiện tại cho các biểu đồ.
- 6 chế độ: bảng xếp hạng, bảng giá trị, tên các tham số, khả năng hiển thị của mỗi tham số, lựa chọn màu và "Tất màu".
- Các bảng giá trị trên mỗi biểu đồ: các chip nhỏ gọn của các métrics của đồng xu hiện tại.
- Tình trạng "Hỗng" thay vì khoảng thời gian khi người dùng xoay băng, vẽ hoặc tương tác với biểu đồ.
- Một khối trang nổi: các nút ở đầu, trang sau, trang trước và cuối cùng, cộng với chỉ số tiến độ của cuốn sách.
- Tấm biểu đồ: ticker, thị trường/chợ nếu cần thiết, biểu tượng métrics được bật, nút chế độ đồng xu, nút kết nối và chọn.
- Phanele di động: TF, tùy chọn, nút hướng/các chế độ tuyệt đối, bản cập nhật và sáu với số lượng đồ thị và tùy chọn.
Quy trình từng bước
- Mở chế độ máy tính để bàn "Biểu đồ đã chọn". "Tất cả biểu đồ" luôn được xây dựng từ danh sách hiện tại: sau khi chuyển danh sách, băng sẽ được cấu trúc lại từ đồng xu của nó.
- Bấm Tất cả biểu đồ trên thanh đầu. Vùng biểu đồ trở thành luồng có thể cuộn và nút chuyển sang trạng thái hoạt động. Bảng danh sách coin giữ nguyên trạng thái hiển thị; hãy ẩn hoặc hiện riêng bằng nút danh sách hay Ctrl + X.
- Nhấp vào bảng phân loại, bạn có thể chọn các tùy chọn tham khảo: các thông số báo động, mô hình, Score, vòng số, mức độ, xu hướng, đơn đặt hàng lớn, OI, Funding, P24, V24, NATR, VR, PΔ, Pavg, rBTC, số lượng và số lượng tương đối của các giao dịch.
- Nhấp lại lại vào phép tính hoạt động được thực hiện bởi một chu kỳ phân loại được hỗ trợ của nó từ "Cài đặt → Chung → Các loại và thứ tự phân loại".
- Choose the shared timeframe. The timeframe button near the refresh-period control shows the current shared timeframe. Selecting another value applies it to charts in this mode and saves it as the default for the next open.
- Use Shift + Arrow Left or Shift + Arrow Right to switch the shared timeframe from the keyboard. This is useful when you want to compare the same sorted list on a lower or higher timeframe without opening the dropdown.
- Chọn khoảng 2, 5, 10, 30 hoặc 60 giây để tự động thay đổi. Trong chế độ "Hàn tay", các giá trị tiếp tục được cập nhật, nhưng thứ tự vẫn được cố định cho đến khi bạn nhấn nút cập nhật.
- Mở 6 lên. Đưa hoặc tắt bảng xếp hạng và bảng giá trị riêng biệt; để bảng giá trị, hãy thiết lập chữ ký, hiển thị của mỗi mét và màu. "Tắt màu" trả về màu của chủ đề và mét.
- Khi thay đổi metrics hoặc hướng của băng bằng tay, nó sẽ chuyển sang biểu đồ xếp hạng đầu tiên.
- Trong khi xoay, giữ chỉ số, vẽ hoặc mở các điều khiển, khoảng cách được thay đổi thành "Hát". Chờ cho sự tương tác kết thúc phân loại tự động sẽ tiếp tục mà không có lệnh riêng.
- Đi qua các biểu đồ bằng bánh xe chuột, các phím Home, End, Page Up và Page Down. Home chuyển sang biểu đồ đầu tiên, End sang biểu đồ cuối cùng, Page Up/Page Down chuyển sang một trang hiển thị.
- Nếu có một khối giấy lướt trên biển, hãy dùng các nút của nó để thực hiện cùng một hành động. Bạn có thể di chuyển khối theo khu vực kéo và bánh xe chuột trên khối sẽ xoay quanh băng đồ họa bất kể khối nằm ở đâu.
- Nhấp vào biểu đồ để chọn nó. Chính đồng xu này sẽ được chuyển trở lại chế độ bình thường khi bạn tắt "Tất cả biểu đồ".
- Để phân tích một đồng xu một cách chi tiết hơn, hãy sử dụng nút chế độ đồng xu trong nắp đồ họa. Nó mở ra cùng một thẻ trong cửa sổ nhỏ nhất của một đồng xu với kích thước được đặt trong cài đặt.
- Nếu kết hợp với thiết bị kết nối được thiết lập, hãy sử dụng nút kết nối trong hộp đồ thị để gửi thẻ giao dịch đến Tiger.Trade, MetaScalp hoặc Vataga theo cài đặt tích hợp của bạn.
- Sử dụng nút chọn trong nắp đồ thị để thêm đồng xu vào nhóm chọn. Nếu đồng xu đã có trong nắp đồ thị, nút này vẫn còn hiển thị ngay cả khi không cần chỉ định biểu đồ.
- Nhập vào "Biểu đồ đã chọn", khi bạn cần tiếp tục làm việc với danh sách, ly, báo cáo hoặc mạng lưu lại. Đồng xu được chọn sẽ mở trong khe hoạt động; các liên kết được bật sẽ chuyển các khe liên kết.
- Nhấp vào Tất cả biểu đồ" trong nắp. Chọn TF và tùy chọn, nhấp vào nút ba góc, chuyển hướng hoặc chế độ tuyệt đối, và nhấp vào nút cập nhật, tự chọn lại thứ tự. Số lượng đồ họa, chữ ký, các tùy chọn và màu sắc có thể nhìn thấy được nằm trong số sáu.
- Nhập vào tiêu đề của đồ họa di động mở màn hình đồng xu thông thường. Khi quay lại ứng dụng sẽ khôi phục vị trí trước của băng; trục trặc dọc trên đồ họa sẽ được chuyển qua xoay trang.
Phím tắt mặc định
All charts
Phím
Hành động
Ctrl+Z
Switch between ordinary mode and All charts.
Shift+←/Shift+→
Switch the shared timeframe for charts in this mode.
Home/End
Move to the first or last chart in the sorted feed.
Page Up/Page Down
Move one visible page up or down through the chart feed.
Ảnh chụp màn hình
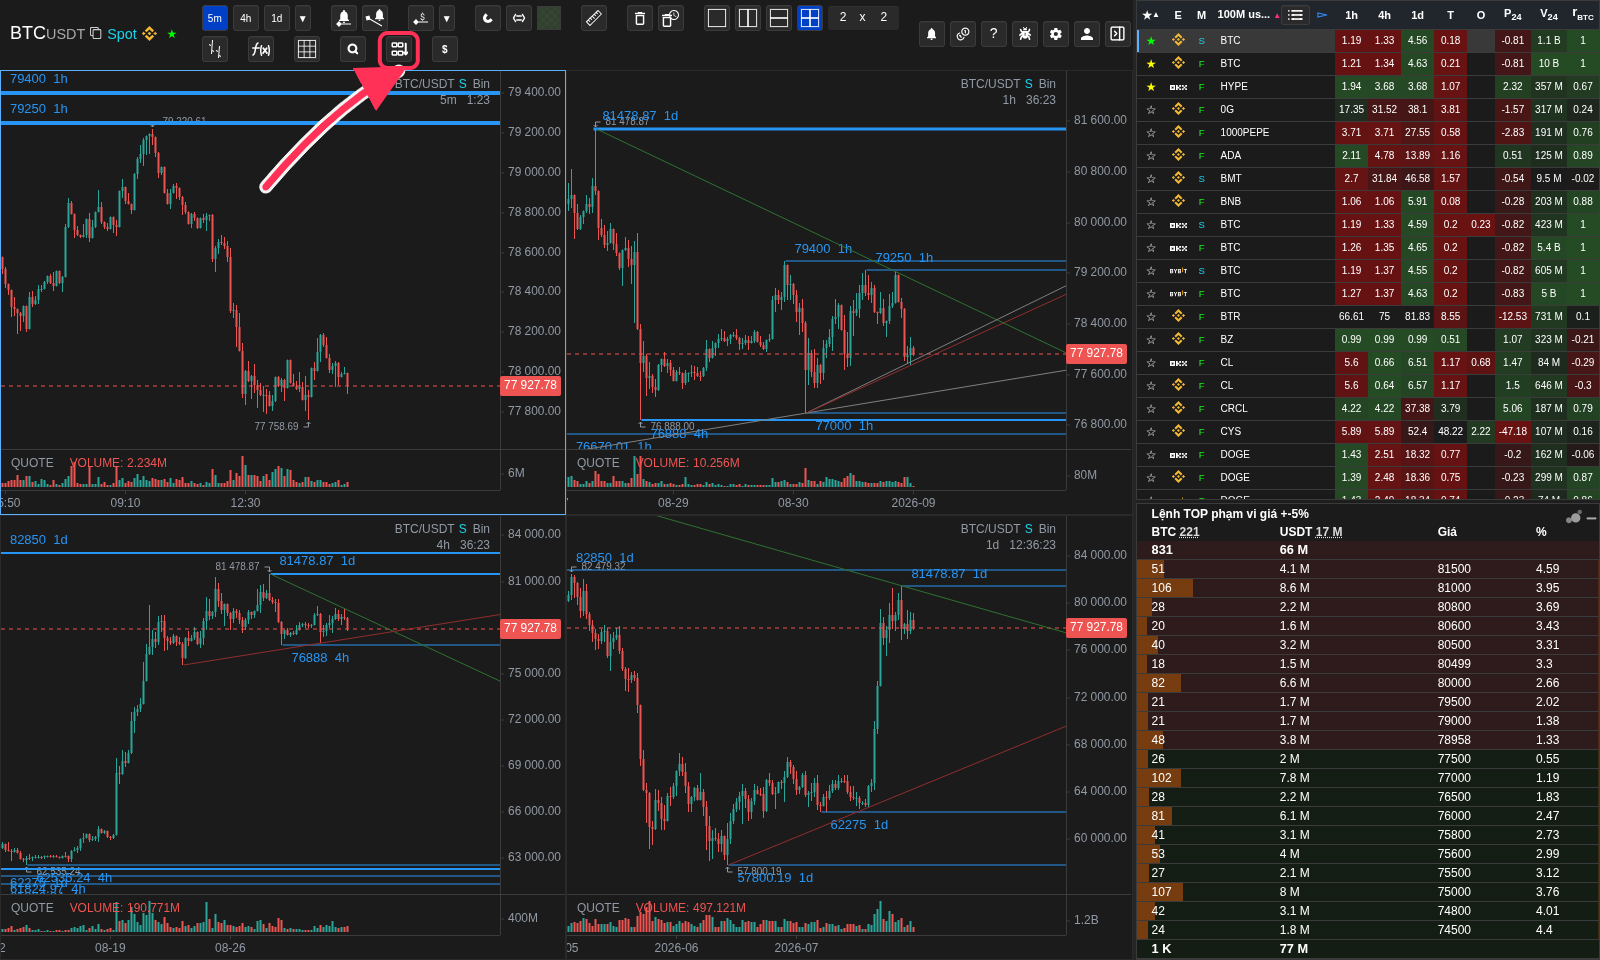
Nơi bật Tất cả biểu đồ
Mũi tên chỉ nút đổi chế độ; Ctrl + Z thực hiện cùng thao tác.
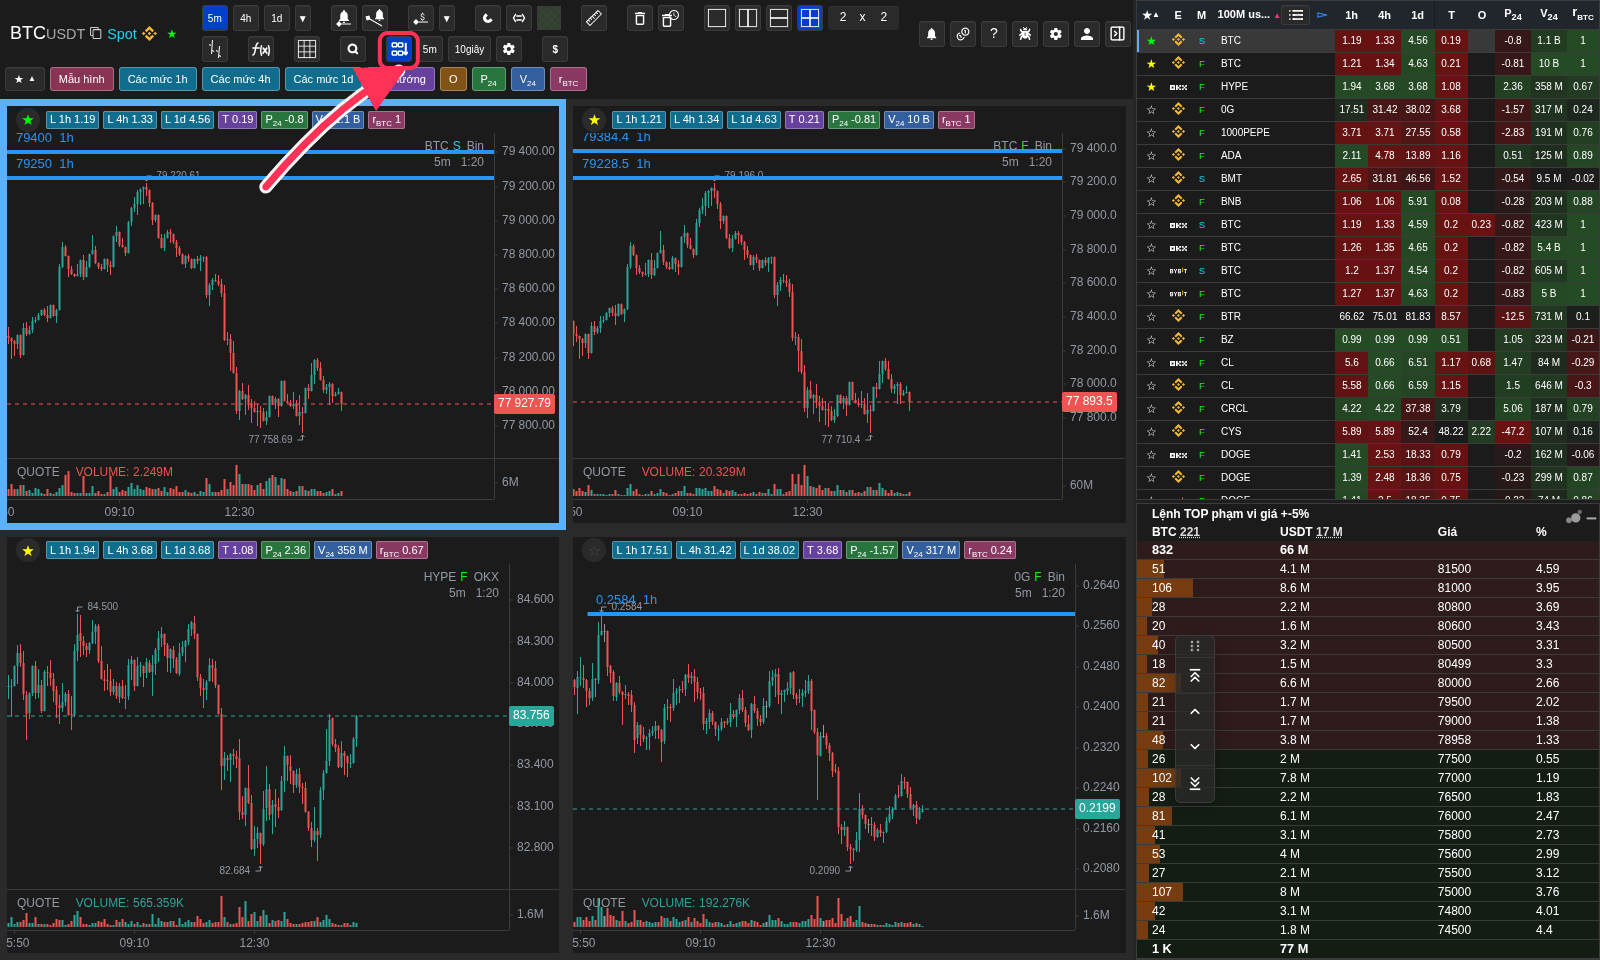
Tất cả biểu đồ với bảng sắp xếp và giá trị
Danh sách coin vẫn hiện, chỉ số xuất hiện phía trên và trong từng biểu đồ.
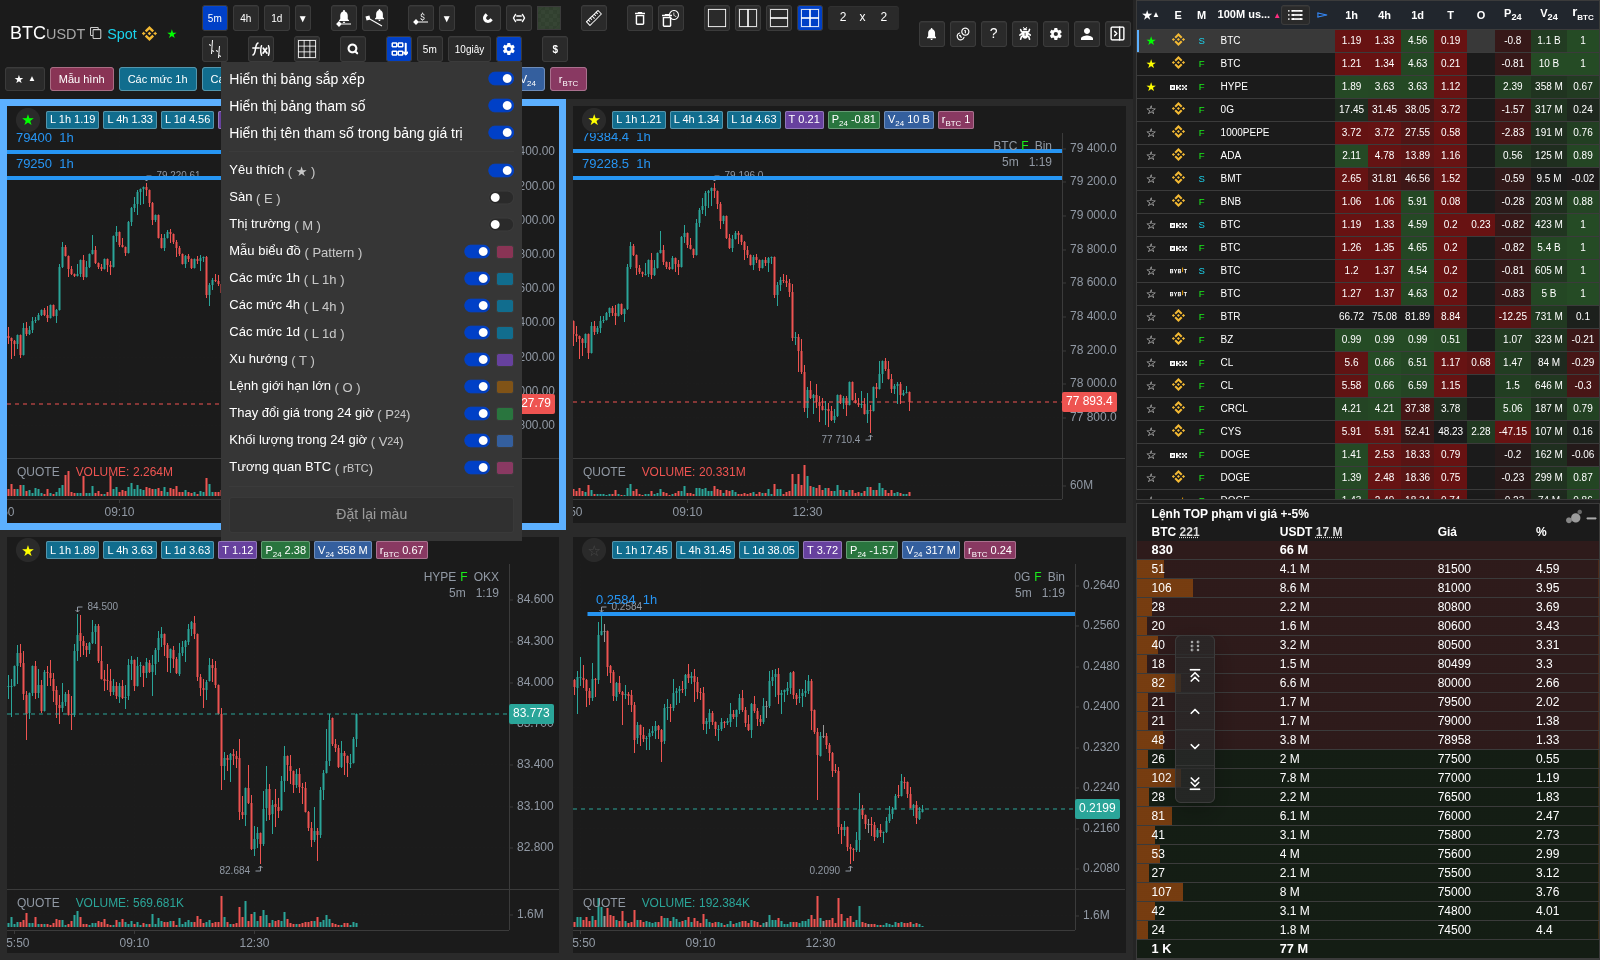
Cài đặt bảng và màu
Nút bánh răng điều khiển bảng, nhãn, hiển thị, màu và khôi phục.
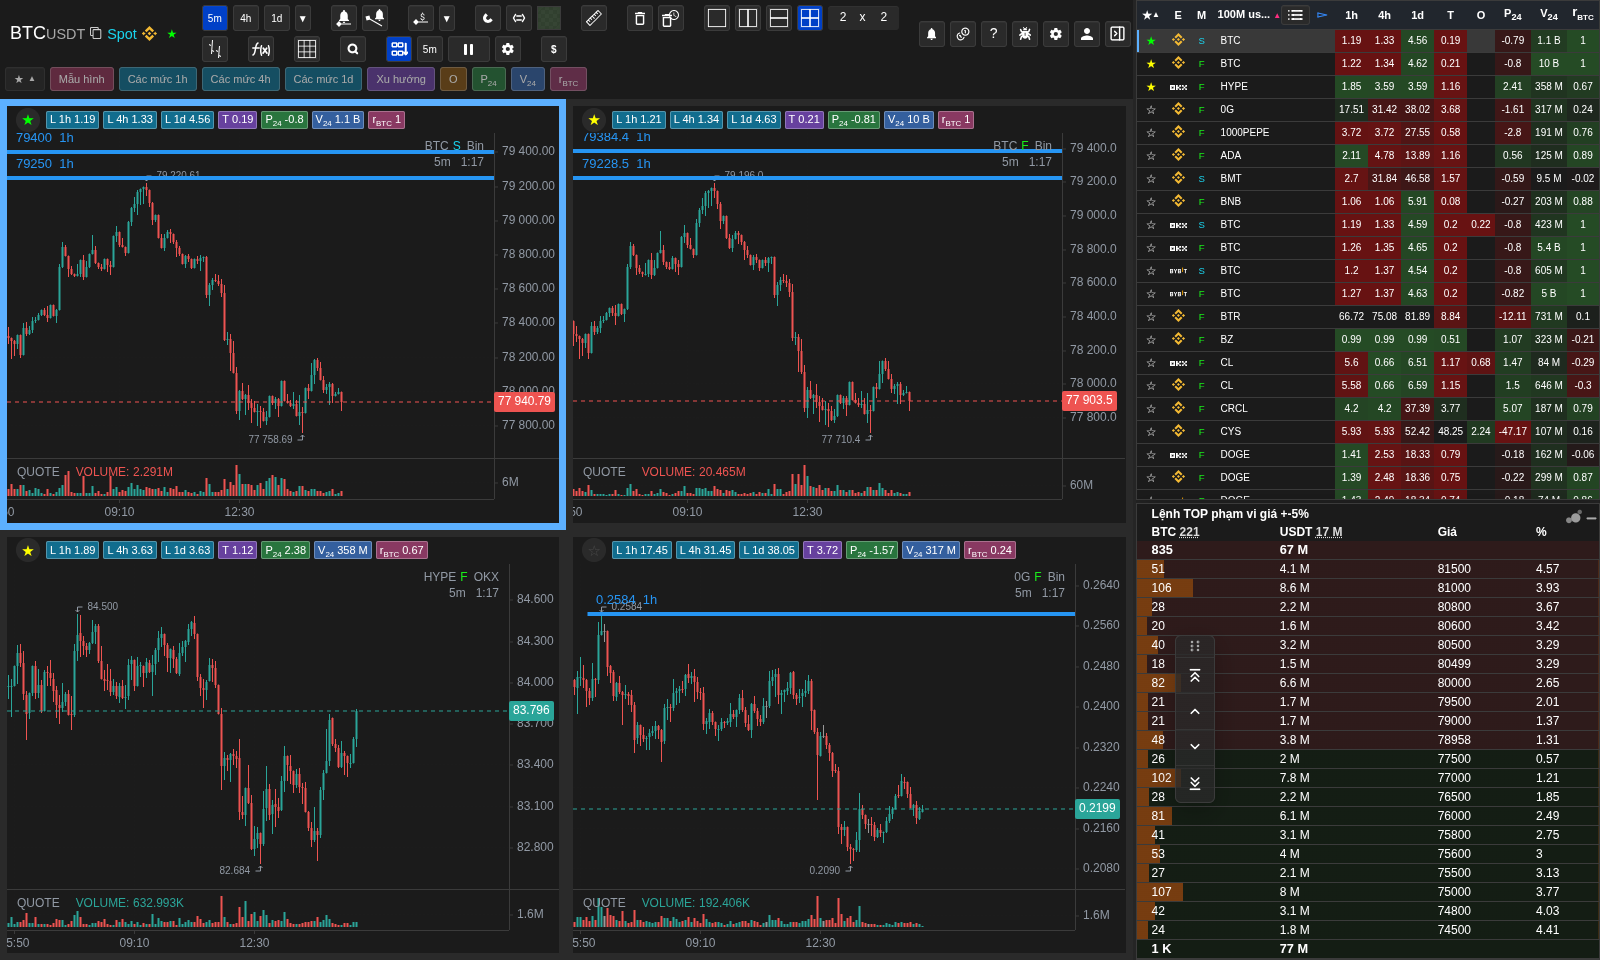
Tự động sắp xếp đang tạm dừng
Khi tương tác, khoảng thời gian đổi thành Tạm dừng rồi tự tiếp tục.
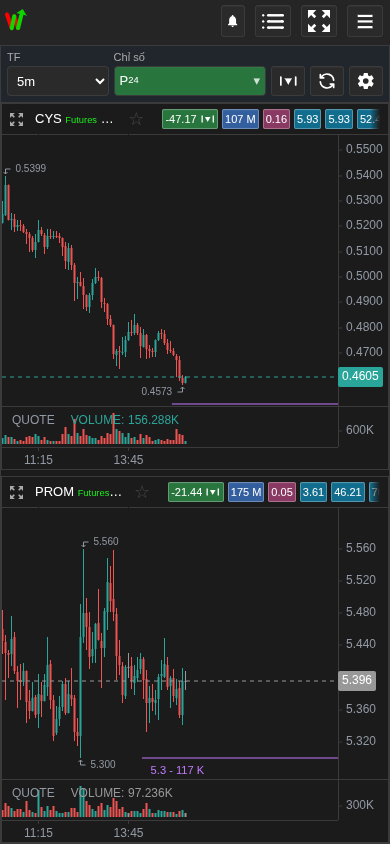
Tất cả biểu đồ trên di động
Thanh đầu có timeframe, chỉ số, chế độ, làm mới và cài đặt.
Lưu ý thực tế
- All charts is not a saved grid. It does not overwrite the tickers, relation links, or overlay state of your ordinary saved grid.
- The current list is the source of truth. Adding, removing, or switching lists changes which coins can appear in the chart feed.
- Các bảng chỉ cung cấp các métrics danh sách có sẵn và được bật. Nếu métrics bị tắt trong cài đặt hoặc không có sẵn cho đồng xu, nút hoặc giá trị của nó có thể không có.
- Các bảng Cài đặt được lưu lại riêng biệt với các thiết lập chung: sự hiển thị của bảng, chữ ký, danh sách các tùy chọn và màu sắc được xác định lại không nên bị mất khi lưu lại phần thiết lập khác.
- Các biểu đồ hiển thị và lề bên cạnh được tải lại giữ lại độ nét, độ chính xác và vị trí của thang khi thay đổi nếu dấu hiệu và khung thời gian phù hợp. Đây là một bức ảnh tạm thời để thay đổi một cách trơn tru, chứ không phải là một bộ nhớ toàn bộ danh sách.
- Việc sắp xếp bằng tay cố tình chuyển đến vị trí đầu tiên của xếp hạng mới. Tự độngSự thay đổi tính toán giữ lại đồng xu được chọn và kết nối của viewport hiện tại để xem không bị trượt mà mà.
- Chuyển, làm chỉ dẫn, điều hướng, vẽ hoặc kiểm soát xuất hiện tạm thời dừng việc chuyển đổi.
- Nếu chọn khoảng tự động, thứ tự có thể thay đổi theo thời gian các giá trị được cập nhật. Để phân tích bằng tay chi tiết, hãy sử dụng chế độ "Hàn tay" và sử dụng các loại mới bằng nút cập nhật.
- Một khung thời gian chung là một chế độ riêng biệt và được giữ riêng biệt với các mạng lưới đồ thị thông thường, để tất cả các ứng cử viên có thể được nhìn thấy đều có thể nhanh chóng được so sánh trên cùng một quy mô nến.
- Không cần thiết để có một khối trang nổi. Bạn có thể bật hoặc tắt nó trong Cài đặt → Chung → hiển thị các nút trang đồ thị.
- Trong các danh sách rất lớn, dữ liệu biểu đồ có thể xuất hiện dần dần. Điều này là bình thường: chế độ ưu tiên các vùng nhìn thấy và các dòng lân cận, và danh sách vẫn là nguồn phân loại.
- Một vị trí cao trong băng đồ thị không phải là tín hiệu thương mại. Nó chỉ có nghĩa là đồng xu nằm cao theo các tùy chọn của danh sách và cần phải kiểm tra bằng tay trên biểu đồ.
- Trên điện thoại di động, các métrics có thể được cập nhật mà không cần thay đổi tự động.
- Trong chế độ demo ẩn danh, điều chỉnh theo mặc định: P₂₄ giảm, tự động đặt lại mỗi 10 giây và kết hợp lên đến 3×3 trong cửa sổ máy tính để bàn.
Khi nên dùng
- Dùng khi danh sách đã xếp hạng coin và bạn muốn xem lần lượt các biểu đồ mà không phải mở từng ticker.
- Hữu ích để so sánh nhiều ứng viên theo cùng khung thời gian và cùng cách sắp xếp.
- Sử dụng chế độ "Handbook" khi bạn muốn giữ lịch trình của mình trong thời gian xem.
Khi không nên dựa vào
- Không dùng vị trí biểu đồ làm tín hiệu vào lệnh; chế độ này chỉ trực quan hóa thứ tự của danh sách.
- Không kỳ vọng chế độ này lưu ticker vào bố cục biểu đồ thông thường; đây là chế độ xem tạm thời của danh sách hiện tại.
- Không bật tự động làm mới khi đang xem kỹ một phần của danh sách lớn và không muốn biểu đồ đổi chỗ.
Các lỗi diễn giải thường gặp
- Nhầm biểu đồ theo danh sách đã sắp xếp với bố cục biểu đồ đã lưu. Bố cục đã lưu là cố định; chế độ này được dựng lại từ danh sách hiện tại.
- Để lại bản cập nhật tự động trong thời gian đánh giá bằng tay và cho rằng ứng dụng đã mất biểu đồ khi xếp hạng thay đổi.
- Đổi danh sách hoặc chỉ số sắp xếp nhưng vẫn kỳ vọng thứ tự biểu đồ cũ còn phù hợp.
- Đánh giá chỉ số "Hát" là lỗi dữ liệu nó có nghĩa là tạm dừng việc chuyển đổi cho thời gian tương tác.
Thuật toán và công thức cần hiểu
- Why the chart feed follows the current list sorting rather than a separate saved grid order.
- Tại sao chế độ "Handbook" giữ cho thứ tự đồ họa ổn định cho đến khi các giá trị danh sách tiếp tục được cập nhật.
- Tại sao việc chọn lựa bằng tay bắt đầu từ đầu, và tự động giữ lại đồng tiền và vị trí được chọn.
- Như một ảnh tạm thời của biểu đồ tải chuyển các ngọn nến và trạng thái viewport đến một vị trí mới mà không cần tải lại.
- Tại sao sự tương tác của người dùng tạm thời dừng lại việc chuyển đổi đồ thị.
- Tại sao khi quay lại chế độ bình thường, bạn sử dụng đồng xu của biểu đồ đã chọn và sử dụng liên kết nếu chúng được bật.
- Tại sao khung thời gian chung được lưu trữ riêng biệt với khung thời gian của mạng lưới thông thường.
- Tại sao các giá trị di động được cập nhật riêng biệt với việc tự đặt lại thứ tự.
- Tại sao băng đồ thị được phân loại lại thuận tiện để xác nhận trực quan, nhưng không thay thế cho việc kiểm tra ý tưởng thương mại bằng tay.