Guide
Glossary
This section collects all terms that appear across the guide. If you are new to trading or crypto, start here: find the unfamiliar word and read the short explanation.
Trading basics
- Spot market
- Trading with immediate delivery of the asset. In the spot market, the buyer receives the coin immediately, and the seller gets the cash. There's no leverage by default: you spend exactly what you have in your account.
- Futures
- Contract for buying and selling an asset in the future. In crypto, futures usually refer to perpetual contracts. Futures allow trading with leverage and opening short positions.
- Perpetual futures
- Futures without an expiration date. Unlike classic futures, a perpetual contract has no delivery date. The price is kept close to the spot price through a funding mechanism.
- Leverage
- Trading with borrowed funds beyond your deposit. 10× leverage means you're controlling a position 10 times larger than your margin. Profits and losses are also multiplied by 10. The higher the leverage, the closer the liquidation level is to the entry price.
- Margin
- Collateral held by the exchange for a leveraged position. Margin is the part of your account that is locked as collateral for the position. If losses consume the margin, the exchange forcibly closes the position — that's liquidation.
- Liquidation
- Forced closure of a position when margin is exhausted. This occurs when the price reaches the liquidation level: the exchange closes the position to prevent the debt from exceeding the margin. The higher the leverage, the closer the liquidation level is to the entry price.
- Long
- Position expecting price to rise. The trader buys the asset and profits if the price goes up. In futures, a long position is opened without immediate payment of the full amount: margin is used as collateral.
- Short
- Position expecting price to fall. The trader sells an asset they don't own, planning to buy it back cheaper later. In futures, margin serves as collateral for shorts.
- Stop-loss
- Order that closes the position upon reaching an acceptable loss. A stop-loss limits losses: if the price hits the specified level, the position closes automatically. It's best to set the stop-loss level beyond a logical point of idea cancellation, not at a random distance.
- Take-profit
- Order that locks in profit upon reaching a target. When the take-profit level is hit, the position closes automatically. The take-profit level is usually set at the nearest significant level, trend, or liquidity area.
- PnL
- Profit and loss of a position. PnL can be unrealized (position open) or realized (position closed). In WatchlistTop, the position closure marker on the chart shows the final PnL of the trade.
- R:R (Risk:Reward)
- Ratio of planned profit to planned loss. R:R 1:2 means the target is twice as far as the stop. If the stop is 1% from entry — the minimum acceptable target is 2%. The higher the R:R, the lower percentage of profitable trades needed for breakeven.
- Scalping
- Trading strategy of quick trades on short movements. A scalper makes many trades with small target movements (0.1–1%) on lower timeframes (1m–15m). Key factors are tight spreads, fast execution, and strict loss control.
- Timeframe
- Time interval represented by one candle on the chart. 1m — one candle = 1 minute, 1h — 1 hour, 1d — 1 day. Signals on higher timeframes (4h, 1d) are considered more significant than on lower ones (1m, 5m). In WatchlistTop, timeframes affect the calculation of metrics, levels, and patterns.
- Candle
- OHLC bar on the chart: open, high, low, and close prices. The body of the candle is the difference between the open and close prices. The wick (shadow) is the distance to the high or low. A long upper wick indicates rejection from high prices; a long lower wick indicates support at low prices.
- Quote asset
- Asset in which the price of the trading pair is expressed. In the pair BTC/USDT, the quoted asset is USDT. The price of BTC is expressed in USDT. In WatchlistTop, you can filter coins by quoted asset (USDT, BTC, ETH, and others).
- Base asset
- Coin whose price is expressed in the quoted asset. In the pair BTC/USDT, the base asset is BTC. This is the price you see in the order book and on the chart. When trading on the spot market, you buy and sell the base asset.
Market structure
- Orderbook
- List of limit buy and sell orders. Bids (buy orders) are below the current price, asks (sell orders) are above. Large orders in the order book can act as temporary support or resistance if the price reacts to them.
- Bid
- Best buy order in the order book. Bid is the price at which buyers are ready to buy right now. The total bid volume in the near zone reflects buying pressure.
- Ask
- Best sell order in the order book. Ask is the price at which sellers are ready to sell right now. The difference between ask and bid is called the spread.
- Spread
- Difference between the best ask and best bid. A narrow spread indicates high liquidity — trades occur with minimal slippage. A wide spread increases actual entry and exit costs. For scalping, it's important to trade pairs with a narrow spread.
- Level
- Horizontal price zone of support or resistance. A level is a price area where the market has historically reversed or slowed down several times. The older the timeframe showing the level, the more significant it is. WatchlistTop automatically finds levels on selected timeframes.
- Trend line
- Diagonal line through lows or highs. An uptrend line connects consecutively rising lows; a downtrend line connects falling highs. Touching a trend line can become a reaction area or a breakout.
- Breakout
- Price moving beyond a level or trend line. A breakout is considered stronger if the candle closes beyond the level and volume increases simultaneously. A false breakout occurs when the price crosses the level but quickly returns.
- Retest
- Price returning to a broken level after a breakout. After a breakout upwards, the former resistance level becomes support, and the price may return to it. Entering on a retest provides a clearer distance to the stop than entering on the first impulse candle.
- Imbalance
- Dominance of buying or selling pressure in the order book. In WatchlistTop, imbalance is a line below the order book showing total bid and ask within 5% of the current price. If bids significantly exceed asks, buying pressure dominates in the near zone.
- Absorption
- Trades absorb a large order, after which the price continues. If the price approaches a large order, the order disappears and the price continues in the same direction — the order is absorbed. Absorption signals continuation rather than reversal.
- Squeeze
- Sharp movement caused by the liquidation of over-leveraged positions. When too many traders are positioned in one direction with leverage, even a small movement against them triggers a chain of liquidations. The movement is sharp and short — entering without a clear stop is extremely risky.
- Setup
- Specific market situation with conditions for entry. A setup is a set of conditions under which an entry is considered justified: level or pattern, confirmation by activity, clear point of idea cancellation. Without predefined conditions, any entry is an impulsive decision.
- Invalidation
- Level at which the trade idea becomes invalid. Cancelling an idea is not an arbitrary stop, but a logical point: 'if the price reaches here, I was wrong about the scenario.' The position size is calculated based on the distance to the invalidation level.
Crypto-specific concepts
- Open Interest (OI)
- Total volume of open futures contracts. OI increases when new traders open positions; it decreases when they close them. A rise in OI along with price means new risk is entering the market. A drop in OI during a price move indicates positions are being closed, not new participants coming in.
- Funding rate
- Periodic payment between long and short holders. Funding keeps the perpetual futures price close to the spot price. Positive funding: longs pay shorts — the market is overloaded with buyers. Negative: shorts pay longs. Payments usually occur every 8 hours.
- Liquidation cascade
- Chain reaction of liquidations during a sharp price move. One group of liquidations moves the price, triggering the next. Cascades create sharp, short moves with high noise. Trading at the epicenter of a cascade without a preset stop is risky.
- Notional value
- Total position volume before accounting for leverage. A position of 500 USDT with 5× leverage uses about 100 USDT margin, but the notional is 500 USDT. The risk of the trade is calculated from the notional and the distance to the stop, not from the margin amount.
WatchlistTop metrics and tools
- Screener
- Tool for filtering and ranking coins by metrics. The screener in WatchlistTop is your list of coins with customizable metric columns and sorting. It allows you to quickly find the most active instruments without manually checking each chart.
- ATR
- Average price movement (high−low) over N candles considering gaps. ATR takes into account the distance between the close of the previous candle and the high/low of the current one, providing a more accurate range estimate than a simple high−low difference. It's used as a basis for NATR.
- NATR
- ATR as a percentage of the current price. NATR allows you to compare volatility between coins with different prices. NATR 2% on 15m means the average candle moves 2% of the price. The stop distance should be at least 0.5× NATR, otherwise, the stop gets hit by regular candle noise.
- TA
- Absolute number of trades over the selected period. Shows current trading activity in units. Used alongside TR: a high TA with normal TR indicates a liquid coin; a high TR with moderate TA indicates unusual acceleration.
- TR
- Ratio of current trades to the average over the period. TR 2 means trades are twice the usual amount. A value above 1.5–2 indicates real acceleration in activity. Sorting by TR shows coins with the most unusual trading spikes.
- P24
- Percentage change in price over the last 24 hours. Positive P24 means the price has gone up, negative means it has gone down. Sorting by the absolute value of P24 shows strong movements in both directions. Used as a basic filter for active instruments.
- PΔ / Price change by interval
- Percentage price change of the latest candle on the selected timeframe. PΔ is calculated as (latest candle close or current price − latest candle open) / latest candle open × 100. Configurable in Settings → General Settings → Price change.
- V24
- Percentage change in trading volume over the last 24 hours. V24 above normal indicates the market is more active than usual. Used in conjunction with P24: simultaneous growth in both metrics confirms volume movement.
- Relative volume
- Ratio of the current candle's volume to the average over N candles. V 150% means the current candle is trading 1.5 times more actively than average. Configurable in Settings → General Settings → Relative Volume: timeframe and period of 1–499 candles.
- Pavg
- Average percentage price movement over N candles. Pavg shows the average range a coin moves in one candle of the selected timeframe. Configurable in Settings → General Settings → Average Price Change: 0–500 candles.
- Signal level
- Horizontal alert triggered when the price crosses. Created on the chart using the 'Signal Level' drawing tool. Triggers when the price crosses the specified horizontal line. Allows you to get notified before the breakout candle closes.
- Signal ray
- Directional alert from a specific point on the chart. Unlike a horizontal level, the ray goes at an angle — useful for trend lines. The alert triggers when the price touches the ray line.
- Large order / Buy wall / Sell wall
- Limit order in the order book exceeding the threshold volume. The threshold is set in the settings: Auto mode (average volume × multiplier) or fixed volume. Timeout filters out orders that disappear in seconds. A stable large order is a potential price reaction zone.
- Order heatmap
- Visual map of large orders across all coins in the visible list. Opened from the order book panel. Allows you to compare the placement of large orders across multiple coins. You can limit the maximum distance of an order from the current price (0.1–5%).
- Impulse alert
- Alert for rapid percentage price change over a short time. Configurable in Alerts → Impulse: period (minutes) and change threshold (%). Triggers when the price moves the specified percentage in the given time. Useful for tracking accelerations without constantly monitoring the list.
- Trade activity alert
- Alert for a large trade or a burst of live trade volume. Two modes: Large print (one trade above the quote-volume threshold) and Print burst (current-window quote volume above both the minimum and the average window volume multiplied by the average multiplier). Direction detection can mark whether the burst is dominated by buys or sells. Configurable in Event notifications → By parameters → Print activity.
- Charts by sorted list
- Quick visual overview mode for several coins from the list. Opened by the TOP button in the header (desktop) or the top tab (mobile version). Shows mini-charts of coins sorted by the selected metric. Allows you to assess the structure of multiple candidates in seconds without manual switching.
- Workspace
- Named configuration with grid, list, and display settings. The workspace saves the selected list of coins, grid configuration, columns, and settings. You can create multiple workspaces for different strategies or markets.
- Ruler
- Drawing tool measuring the percentage distance between two points. Allows you to measure the distance from entry to stop and from entry to target to ensure R:R is met before opening a position. Available in the drawing tools panel on the chart.
- API key
- Access key to the exchange for connecting the account in read-only mode. An API key with read-only rights allows WatchlistTop to display positions, orders, and trade history on the chart. Trading rights keys for parsing trades are unnecessary and create extra risk.
Chart Patterns
- Double Top
-
A bearish reversal pattern after a move up: price tests a resistance area twice and fails to hold above it.
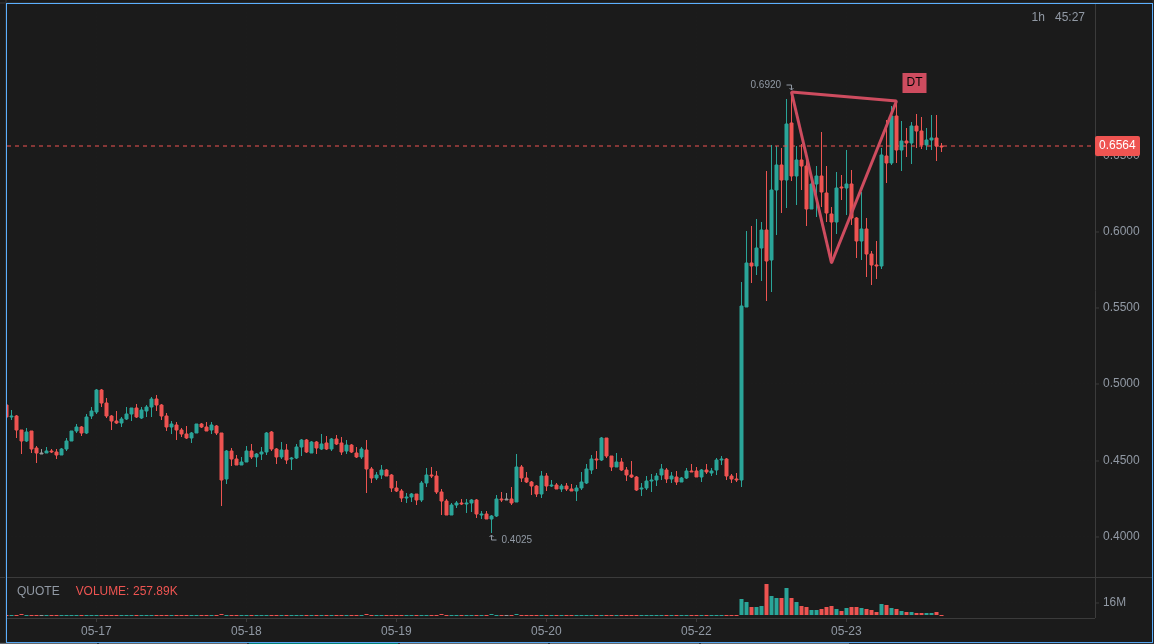 Usually appears after an up move or local overheating. There should be a clear pullback between the two tops, and the tops should sit in roughly the same price area. After confirmation, traders expect a move down toward the interim low and lower, but the pattern is worth considering only near resistance, a large resting order, weakening volume, or signs of Longs closing. Best viewed on 1h, 4h, and 1d; use 5m-15m only for precision entries. Validity improves if price closes below the interim low. Common mistakes: treating any repeated high as a double top, entering before confirmation, ignoring a strong uptrend, and placing the Stop too close to the tops.
- Double Bottom
-
A bullish reversal pattern after a drop: price tests a support area twice and fails to hold below it.
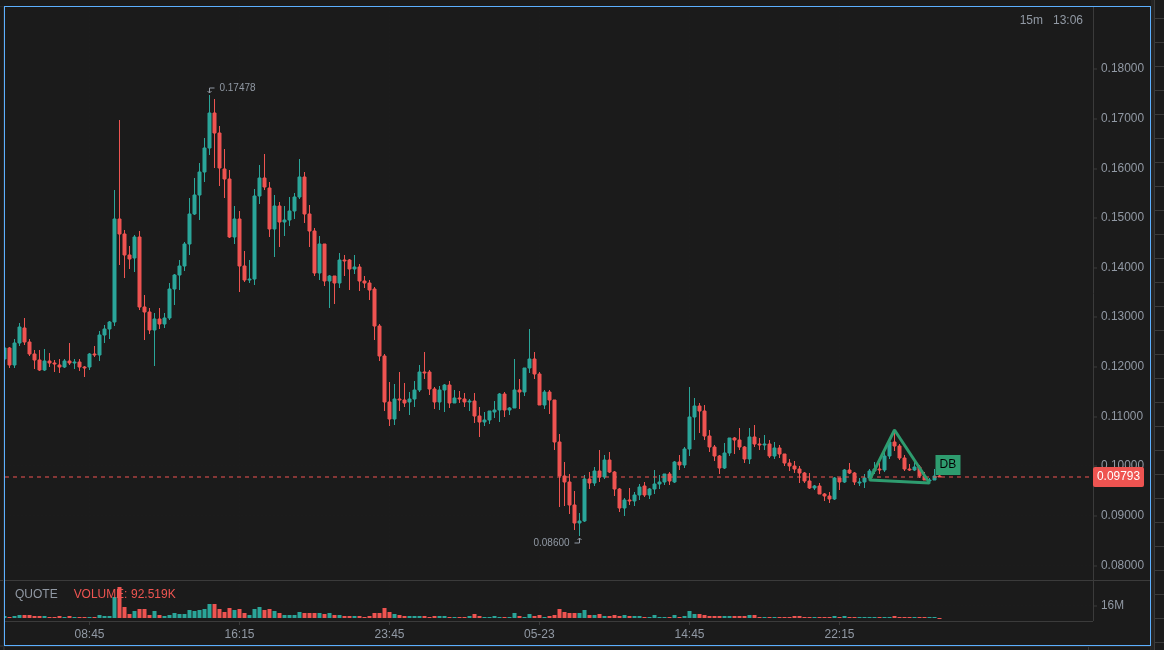 Usually forms after a down move, sell-off, or seller exhaustion. There should be a clear bounce between the two lows, and the lows should be close to each other in price. After confirmation, traders expect a move up toward the interim high and higher. The pattern matters more when it aligns with support, a large bid, rising volume, reduced selling pressure, or Shorts closing. Best viewed on 1h, 4h, and 1d; use lower timeframes only for refinement. Validity improves after a close above the interim high. Mistakes: buying just because price tapped the low a second time, ignoring the broader downtrend, or treating a weak range with no clear bounce as a pattern.
- Head and Shoulders
-
A bearish reversal pattern: three peaks after a rally, with the middle peak higher than the side peaks.
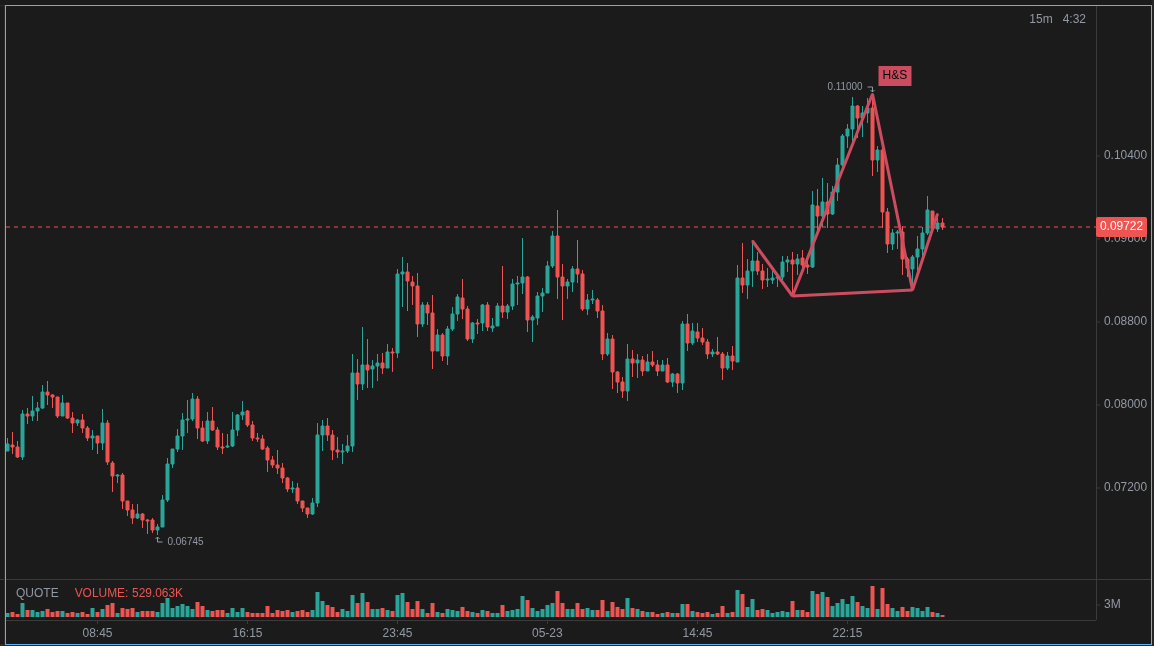 Usually appears after a sustained uptrend. The left shoulder shows the first pullback, the head is the final higher high, and the right shoulder is a failed attempt to continue higher. After a neckline break, traders expect downside, often with a retest of the broken line. Best viewed on 1h, 4h, and 1d, because the structure is often noisy on lower timeframes. It is worth considering when momentum weakens, volume drops on the right shoulder, price is near strong resistance, or the OI/volume context deteriorates. Validity: shoulders are relatively comparable, the head is clearly higher, the neckline is readable, and confirmation is a close below the neckline. Mistakes: drawing the pattern without a prior up move, entering before the neckline break, or treating a heavily asymmetric structure as valid.
- Inverse Head and Shoulders
-
A bullish reversal pattern: three lows after a drop, with the middle low lower than the side lows.
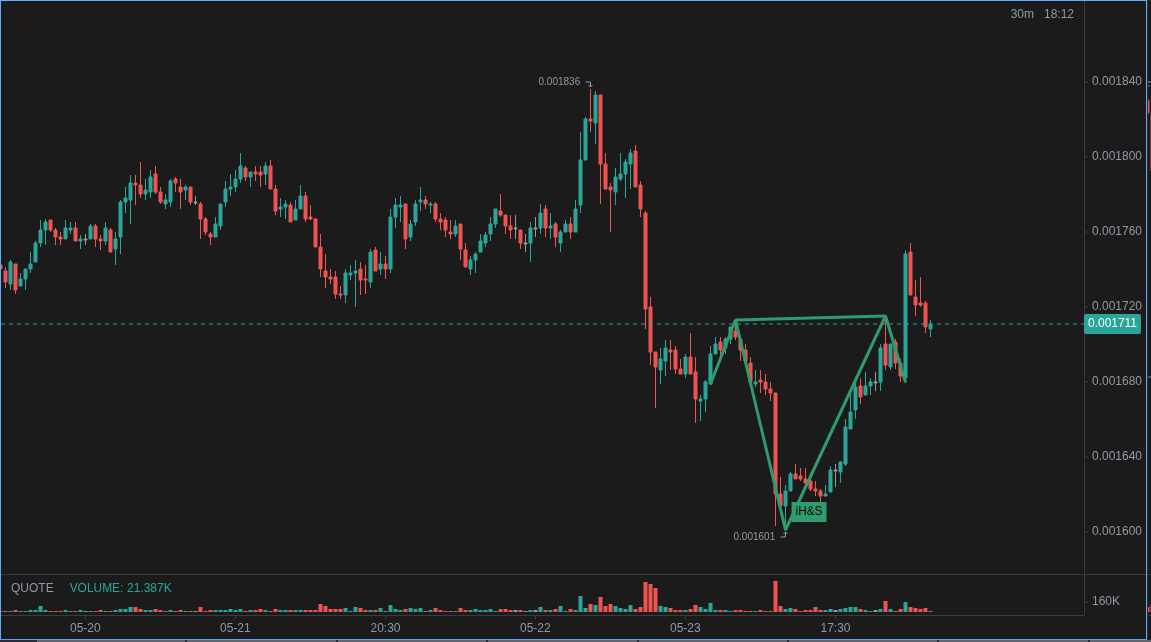 Usually appears after a downtrend or a sharp sell-off. The left shoulder shows the first bounce, the head is the final lower low, and the right shoulder is a failed attempt by sellers to continue the drop. After a neckline break, traders expect upside, often with a retest from above. Best viewed on 1h, 4h, and 1d. It is worth considering at support, with rising buyer activity, fading downside pressure, or volume confirmation. Validity: the head is below the shoulders, the shoulders are not too different, the neckline is clear, and price closes above the neckline. Mistakes: buying before confirmation, seeing the pattern in every range, or ignoring a strong higher-timeframe downtrend.
- Ascending Triangle
-
Usually a bullish pattern with horizontal resistance and higher lows.
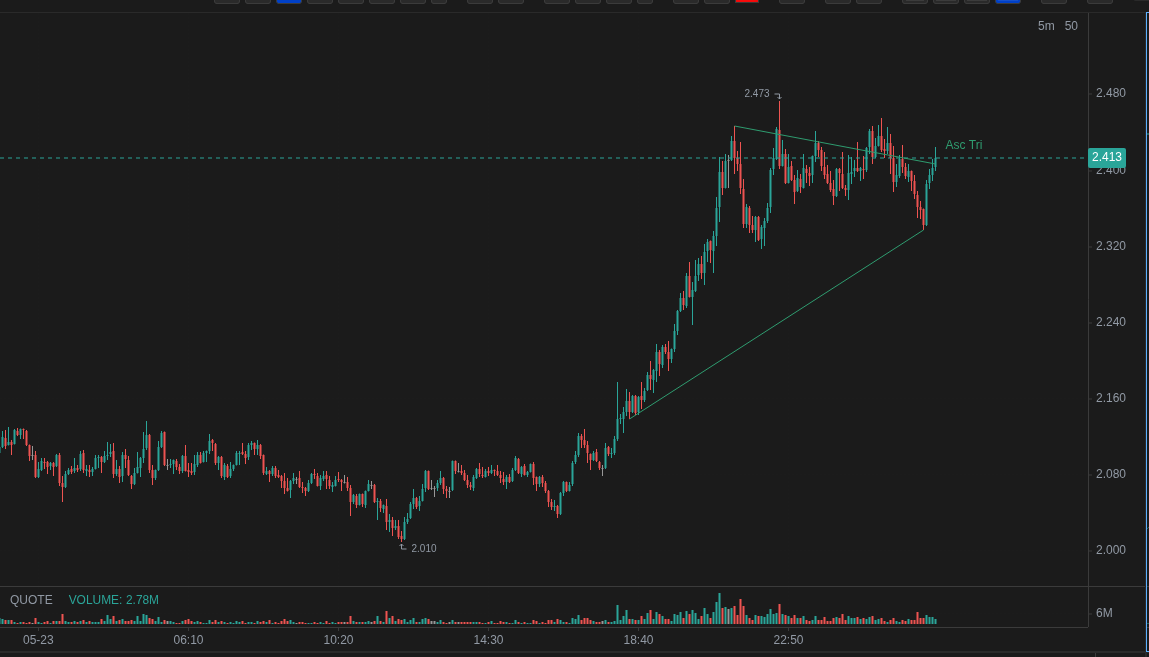 Usually forms after a move up or during accumulation below resistance. Buyers keep pressing price from below, while the seller holds the upper boundary. After confirmation, traders expect an upside breakout; the signal is especially strong if the breakout comes with rising volume and trading activity. Best viewed on 15m, 1h, and 4h; 1d works for swing setups. It is worth considering when the upper boundary lines up with a level and lows keep rising without sharp spikes. Validity: at least two reactions at resistance, several higher lows, range compression, and a close above the upper boundary. Mistakes: buying inside the triangle without confirmation, ignoring a fakeout, or using the pattern against strong selling pressure.
- Descending Triangle
-
Usually a bearish pattern with horizontal support and lower highs.
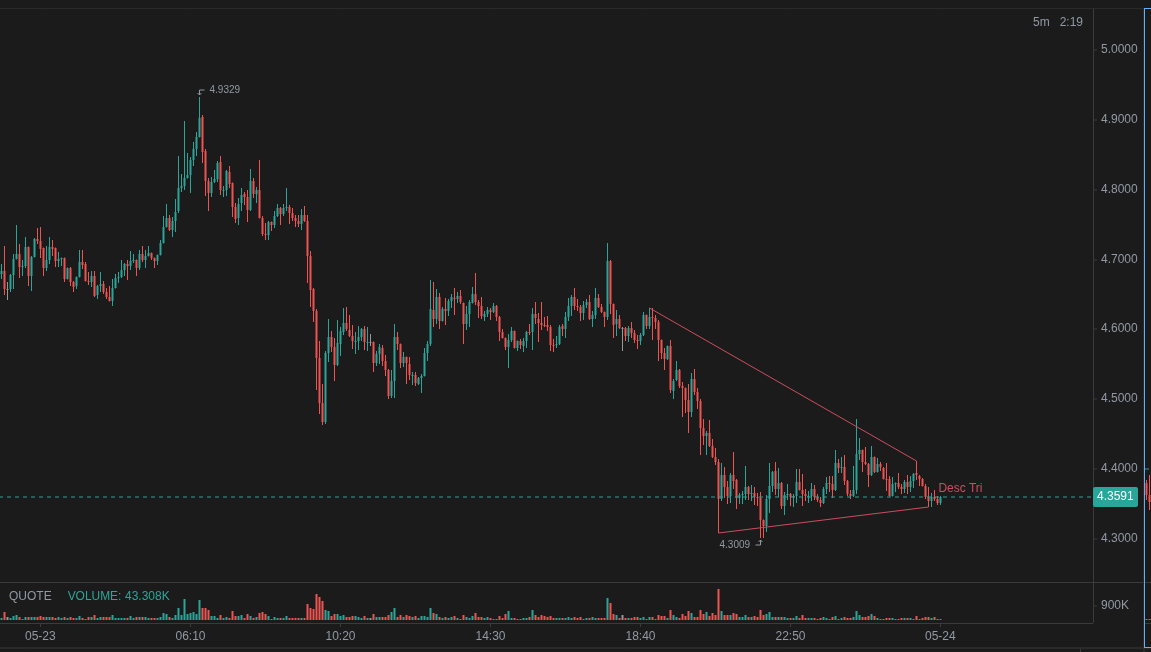 Usually appears after a drop or during distribution above support. Sellers press from above, while the buyer holds the lower boundary until the break. After confirmation, traders expect a move down; it is stronger if the break comes with volume, rising TR, or weak bounces. Best viewed on 15m, 1h, and 4h; use 1d for larger scenarios. It is worth considering near important support or after a series of weak bounces. Validity: several reactions from the lower boundary, lower highs, range compression, and a close below support. Mistakes: shorting before the break, treating a normal range as the pattern, or ignoring large bid orders below support.
- Symmetrical Triangle
-
A compression pattern: highs are getting lower, lows are getting higher, and direction is confirmed by the breakout.
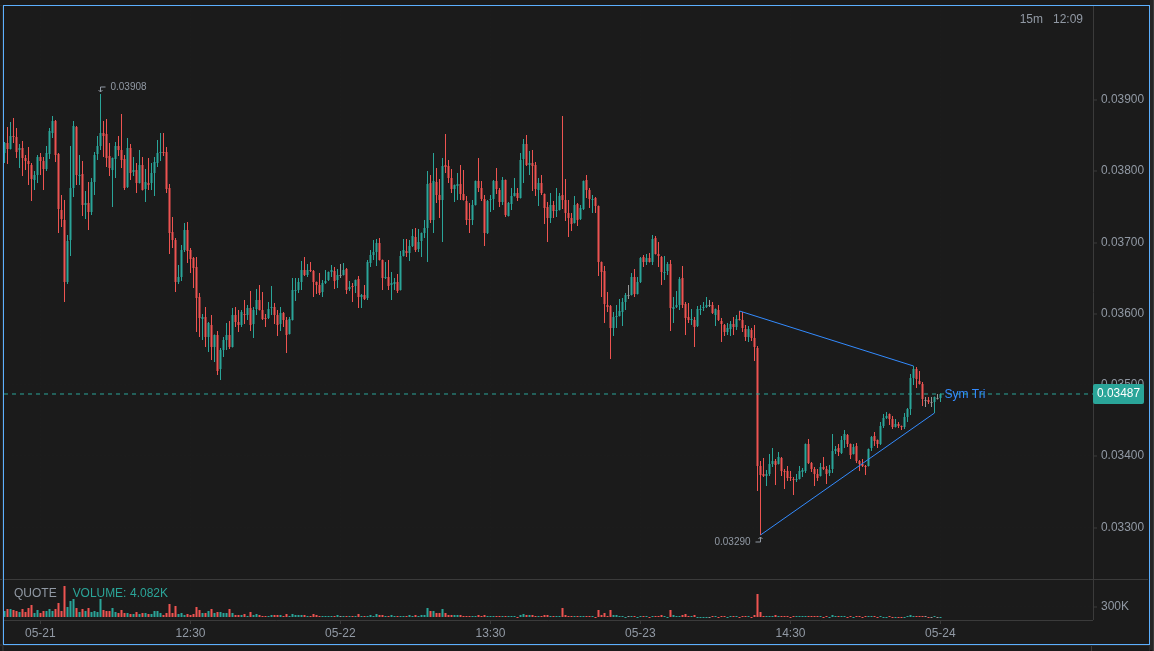 Usually appears after an impulse move or during a pause before the next leg. By itself, it is neutral: after the breakout, price can continue the previous move or reverse, so context matters. Best viewed on 15m, 1h, and 4h; 5m often has a lot of noise. It is worth considering when the range is genuinely compressing and price respects both boundaries. Validity: both lines converge, there are touches from above and below, there are no chaotic breaks inside, and confirmation is a close beyond one of the boundaries. Mistakes: guessing the direction in advance, entering in the middle of the range, or forgetting that the first break can be a fakeout.
- Rising Wedge
-
A bearish compression pattern: price rises inside converging upward boundaries, but momentum is fading.
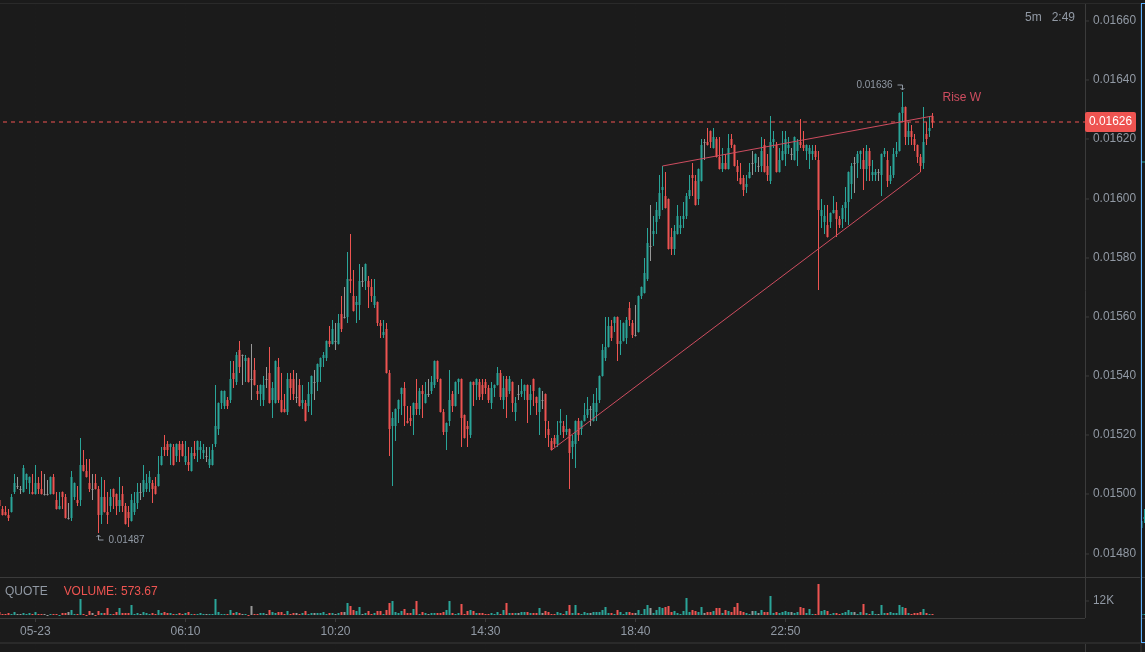 Usually appears after a rally as a sign of exhaustion, or inside a corrective bounce in a downtrend. Lows rise faster than highs, the range narrows, and buyers struggle to keep pushing. After confirmation, traders expect a downside break and acceleration lower. Best viewed on 1h, 4h, and 1d; use 15m only with level and volume confirmation. It is worth considering when volume is weak on the way up, activity diverges, or resistance is overhead. Validity: both boundaries point up and converge, price respects the boundaries several times, and confirmation is a close below the lower line. Mistakes: treating any rising channel as a wedge, shorting before the break, or ignoring a strong bullish trend.
- Falling Wedge
-
A bullish compression pattern: price declines inside converging downward boundaries, but selling pressure is fading.
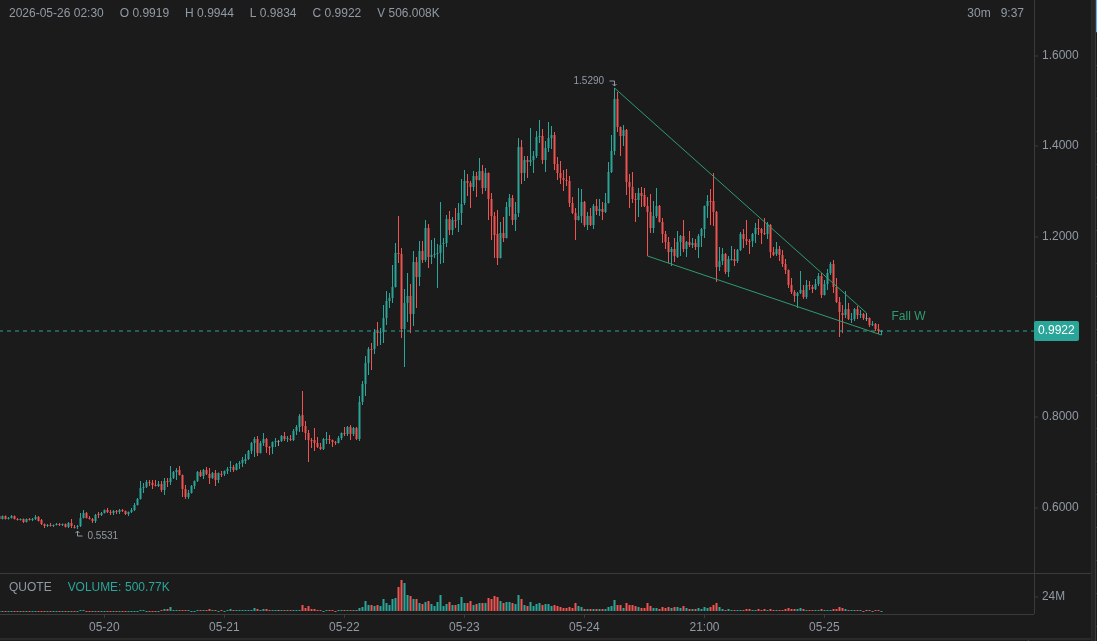 Usually appears after a drop as a sign of seller exhaustion, or as a correction inside an uptrend. Highs and lows move lower, but the range narrows; sellers can no longer accelerate the drop. After confirmation, traders expect an upside breakout and recovery. Best viewed on 1h, 4h, and 1d; use lower timeframes only to refine the entry. It is worth considering at support, with fading downside pressure, rising volume on the breakout, or a positive reaction from a level. Validity: both boundaries point down and converge, there are several touches, and confirmation is a close above the upper line. Mistakes: buying inside the wedge without a breakout, confusing the wedge with a steady descending channel, or ignoring a weak overall market.
When to use it
- Use it when you encounter an unfamiliar term in another section of the guide.
- Open it when you are just starting with trading or crypto.
- Helpful before reading the trading strategies section, to understand the vocabulary.
Typical interpretation mistakes
- Do not confuse notional position size with margin: risk is calculated from the notional, not the collateral amount.
- OI and volume are different metrics: OI shows open positions count, volume shows what traded over a period.
- Funding is not an exchange fee — it is a payment between traders. The exchange does not receive these funds.