Guide
Changes, volumes, trends, levels
The coin list is not just a sorted table. Every column is a live signal derived from market data and updated continuously. Each column has its own meaning, timeframe or window setting, and should be read as a ranking signal rather than a standalone entry trigger.
What this section covers
- What P24 shows: the 24-hour price change percentage, calculated from the price 24 hours ago to the current price.
- What V24 shows: the total trading volume over the last 24 hours expressed in the quote currency.
- What PΔ shows: the price change of the latest candle on the configured timeframe, calculated from that candle's open to its close or current price.
- What the level columns show (default h1, h4, d): the percentage distance from the current price to the nearest confirmed support or resistance level on each configured timeframe.
- What Pavg shows: the average absolute price change per candle over a configured number of candles on a selected timeframe, reflecting typical volatility for that instrument.
- What VR shows: the ratio of the current period volume to the average volume over a configured lookback period on a selected timeframe — values above 1 mean volume is higher than usual.
- What NATR shows: the Normalized Average True Range, expressed as a percentage of the current price, calculated over a configurable number of candles on a selected timeframe (default 14 candles).
- What rBTC shows: the price correlation of a coin with Bitcoin over a selected timeframe — values near 1 mean the coin moves closely with BTC.
- What F shows: the current futures funding rate in percent. The list cell shows the rate without a plus sign or percent sign; the tooltip shows "Funding rate, %" and the time until the next funding when it is available.
- What OI shows: futures Open Interest, meaning the total size of currently open futures positions for the instrument. It does not show long/short direction by itself, but rising or falling OI helps reveal whether new risk is entering the market or positions are closing.
- How the OI cell can be displayed: as the current position size or as the percentage change between the current value and the value 1h, 12h, or 24h ago. The comparison period also controls green/red cell highlighting in Change mode.
- How OI value currency works: in Value mode, "Show value in base coin" controls whether the cell shows base-asset size, for example BTC or SOL, or quote-coin size, for example USDT or USDC. In Change mode, "Calculate change in base coin" controls whether the percentage is calculated from base OI or quote-value OI.
- Why OI change can differ in base and quote: base change measures how the number of open contracts or base units changed, while quote change also includes price movement because quote OI is calculated from OI × mark price when the exchange does not provide a quote value directly.
- OI example: 12h ago OI was 1,000 SOL at a 100 USDT mark price, so quote OI was 100,000 USDT. Now OI is 1,100 SOL at an 80 USDT mark price, so quote OI is 88,000 USDT. Base change is +10%, but quote change is −12% because the position size grew while the mark price fell.
- What the OI tooltip shows: the "Position size" block with base and quote coin values, plus percentage changes for 1h, 12h, and 24h when those comparison points are available.
- How OI sorting works: when the OI column shows Value, sorting uses the current position size; when it shows Change, sorting uses the selected percentage-change period. Empty Change values sort as missing values.
- What TA shows: the absolute number of trades in the selected rolling window. Available windows are 1m, 5m, 15m, and 1h. This column is currently available only for Binance data.
- What TR shows: the percentage difference between the trade count in the selected rolling window and the average trade count over the configured number of previous windows. This column is currently available only for Binance data.
- What Score shows: a scenario score from the selected scoring profile. It can use a built-in profile or a custom profile. The app combines several metric components with profile weights so the list can be ranked by how well each coin fits the selected scenario.
- What the Score tooltip shows: selected profile, total Score, available weight, each component contribution, and missing-data lines for components that could not be calculated. Missing data means that component did not add a positive contribution.
- What the levels, trends, and order distance columns show in the list and how they link to the corresponding overlays on the chart.
- Why values in Watchlist.top can differ from exchange UI numbers — the aggregation window, timeframe, and lookback period are configurable and may not match what the exchange shows by default.
Key screens and controls
- Coin list with multiple metric columns visible: Score, P24, V24, NATR, PΔ, Pavg, VR, level-distance columns, rBTC, OI, F, TA, and TR.
- Column header with sort arrows and the controls to show or hide individual columns.
- Score cell tooltip showing profile name, component contribution, available weight, and missing data.
- OI cell tooltip showing current position size in base and quote coins plus 1h, 12h, and 24h percentage changes.
- Funding cell tooltip showing funding rate in percent and time until next funding.
- Chart with level overlay showing the nearest support/resistance that corresponds to the percentage distance in the level column.
- Settings → Common tab showing timeframe/count fields for PΔ, Pavg, VR, rBTC, trends, and the separate trades window.
- Settings → Common tab showing NATR timeframe and candle count.
Step-by-step flow
- To sort the list by a metric, click the corresponding column header. Click again to reverse the order. If absolute-value sorting is enabled in Settings → Common and the metric can be negative, repeated clicks cycle through signed and absolute-value sort modes. The sort column, direction, and mode are saved with the list.
- To enable or disable a column, open the column visibility controls in the list header. Not all columns are shown by default.
- To use Score, open Settings → Common, enable Scoring, choose a built-in profile or create a custom one, apply recommended parameters if needed, save settings, and then sort the list by the Score column.
- To use Funding, open Settings → Common and enable the Funding column. Use the F column to compare current funding pressure across futures instruments.
- To use Open Interest, open Settings → Common, enable the OI column, choose whether the cell should show Value or Change, choose the comparison period, and choose whether Value or Change should use base coin or quote coin.
- To configure the timeframe for PΔ, Pavg, VR, rBTC, or trends, open Settings and go to the Common tab. Trades use their own rolling window setting, independent of the chart timeframe buttons and the common analyzed intervals.
- To configure the timeframe and candle count for NATR, open Settings and go to the Common tab. The default is 14 candles.
- To understand why a value in the distance-to-level columns is high or low, open the coin chart. The nearest level line visible on the chart corresponds to the percentage distance shown in the list.
- To see where large orders sit relative to the current price, check the order distance column or open the orderbook panel for that coin.
- Use VR as a ranking signal: sort by VR descending to find coins with unusually high activity compared to their own average.
Screenshots
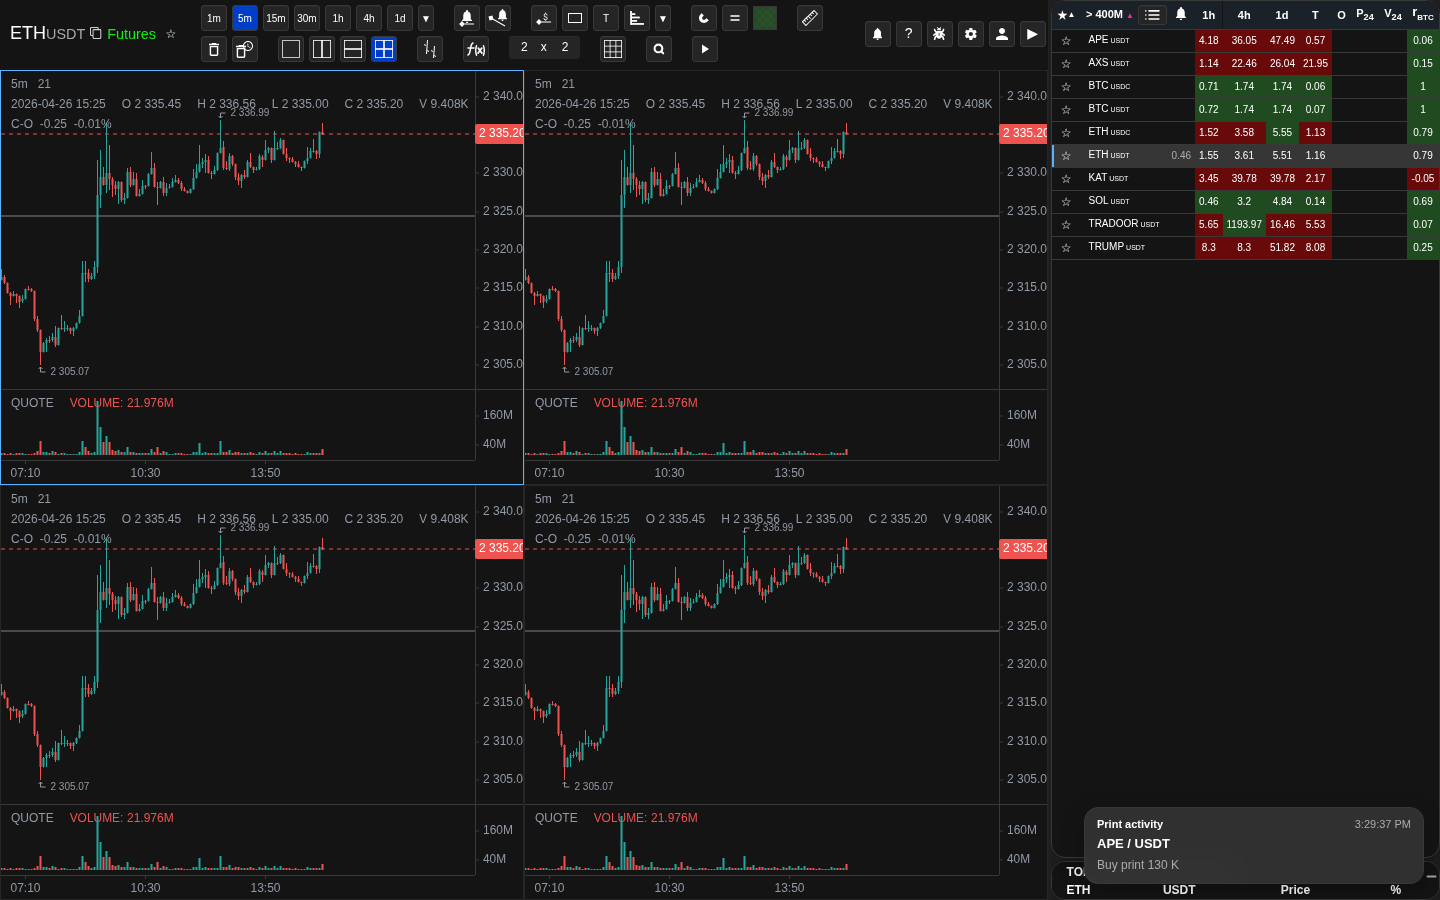
Coin list sorted by VR descending
Sorting by VR brings coins with unusually high volume relative to their own average to the top.
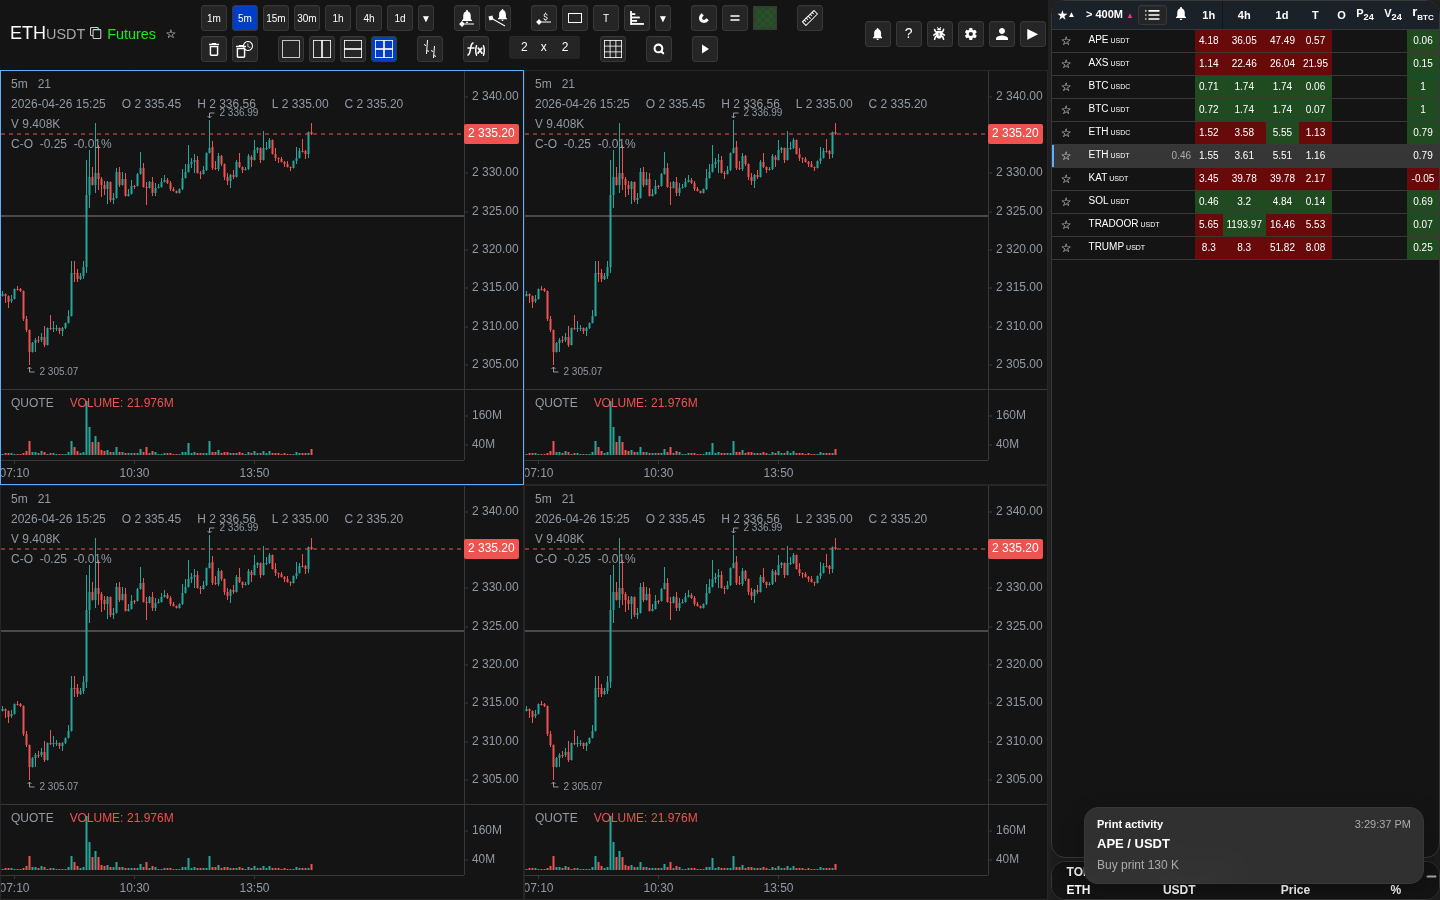
Level-distance column and corresponding level line on the chart
The same coin in the list and on the chart makes the distance-to-level measurement concrete.

NATR and Pavg columns side by side
NATR and Pavg can be compared side by side as volatility-related metrics.
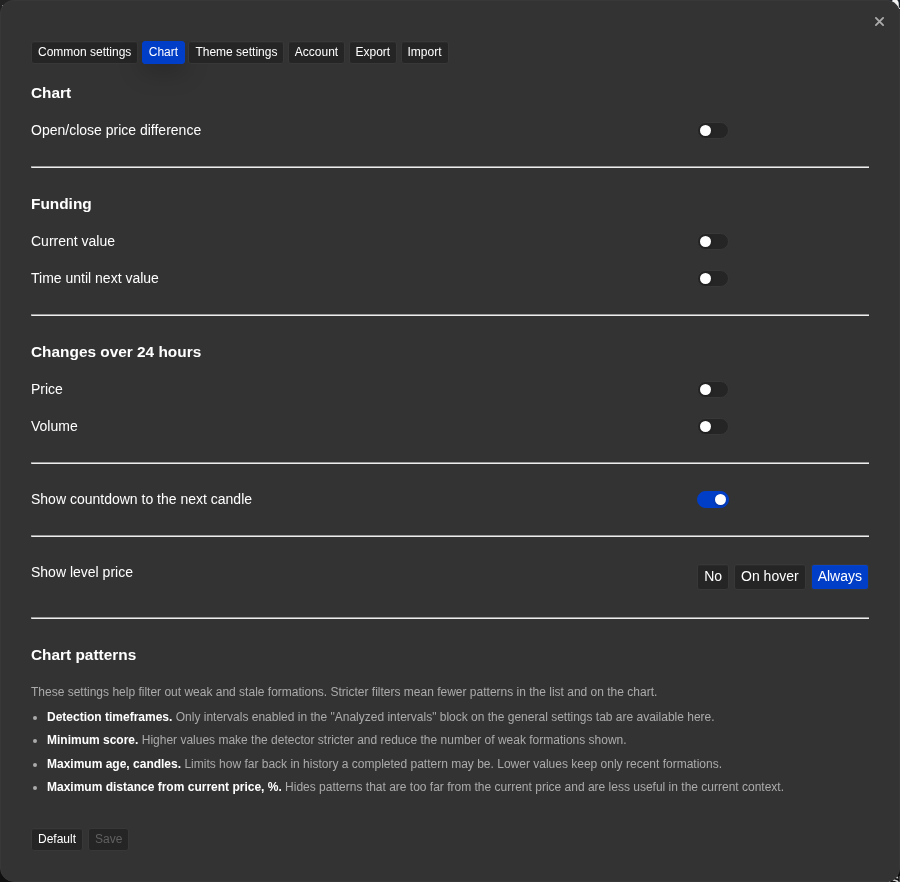
Metric windows in the Common tab
The Common tab controls each metric window and lookback period, including the separate rolling window for trades.
Operational notes
- All metric columns show values derived from market data Watchlist.top has already processed. The freshness of each value depends on the update cadence for that metric.
- Sorting by a metric is a ranking operation, not a filter. Coins outside the sorted range are still part of the list.
- Absolute-value sorting is available only for columns where the value can be negative. It is useful when the size of the move matters more than whether the value is above or below zero.
- P24 and V24 use a rolling 24-hour window, not a fixed calendar day, so values change continuously.
- PΔ uses the latest candle of the configured timeframe. During an open candle, the value can change until that candle closes.
- VR above 1 means current volume exceeds the configured average. A value of 2.0 means twice the average — but the baseline itself depends on the configured lookback period in settings.
- NATR is expressed as a percentage of the current price, so it can be compared across coins of very different price levels without normalizing manually.
- rBTC close to 1 or -1 is meaningful; rBTC near 0 means the coin moves independently of BTC during the measured period.
- TA and TR are trade-count metrics, not quote-volume metrics. They count how many trades occurred, not how much quote currency was traded.
- Funding is a futures-only metric. Spot instruments do not have perpetual funding, so the F cell can be empty for spot-only symbols.
- Funding is shown as a percentage rate. A positive value means longs pay shorts at the funding event; a negative value means shorts pay longs. It is useful context for market crowding, not a standalone entry signal.
- OI is a futures-only metric. Spot instruments do not have futures Open Interest, so the OI cell can be empty for spot-only symbols.
- OI change compares the current value with a saved value from the selected time ago. If that past point is not available yet, Change mode leaves the cell empty.
- Base-coin OI change and quote-coin OI change answer different questions. Base change shows whether the open position amount grew or fell; quote change shows whether the notional value of those positions grew or fell after price movement is included.
- If OI is still loading, the tooltip can show "Waiting for data...". If the instrument has no usable OI data, the tooltip can show "No data".
- When OI is displayed as quote-coin Value, the list uses a one-color green intensity scale for the cell background. When OI is displayed as base-coin Value, the OI cell is not gradient-colored.
- A larger OI value means more open position size, not necessarily bullish or bearish direction. Direction must be interpreted together with price movement, volume, funding, orderbook, and trades.
- For TA and TR, the 1h option is a rolling sum of the last 60 one-minute candles, not the currently open exchange 1h candle.
- TA and TR currently depend on Binance trade-count data. Other exchanges may show no value for these columns until equivalent data is available.
- Score uses only components that can be calculated from currently available data. If a component has no data, it is shown in the tooltip and does not add positive contribution.
- Applying a scoring profile is not a permanent snapshot of metric settings. If you change a metric setting after applying the profile, Score uses the updated current value on the next calculation.
- A high Score is a ranking signal for manual review. It should not be treated as a standalone trade entry signal.
- Level columns show the distance to the nearest level on their configured timeframes. If no level exists for that coin and timeframe, the cell may be empty.
When to use it
- When you see a value in a list column or chart overlay and want to know what it actually means.
- When you need the formula, thresholds, and practical trading interpretation all in one place.
- When you want to compare a value across different markets and need to verify the context matches.
When not to rely on it
- If your problem is about account access, email state, or notification delivery.
- If you only need to find where a control is — the reference section is faster.
Typical interpretation mistakes
- Trusting a metric without checking its time window and update frequency.
- Comparing values across markets without making sure the parameters and context match.
- Expecting values to match the exchange display when the aggregation logic is different.
Algorithms and formulas to understand
- How P24 and V24 are computed from a rolling 24-hour data window rather than a fixed calendar boundary
- How PΔ measures the latest candle's percent change from open to close/current price
- How NATR normalizes ATR as a percentage of the current price to make volatility comparable across different price levels
- How Pavg averages absolute open-to-close candle changes over the configured candle count
- How VR divides the current period volume by the rolling average volume to produce a dimensionless activity ratio
- How OI display mode controls whether sorting and cell value use current position size or selected-window percentage change
- How base-coin OI change can differ from quote-coin OI change when mark price changes during the comparison period
- How TA and TR use rolling trade-count windows and compare the current window with the configured average
- How Score combines multiple metric components using the selected scoring profile weights
- How level columns measure the percentage distance from the current price to the nearest level on each configured timeframe
- How rBTC compares the coin price changes with BTC price changes over the selected timeframe window
- How absolute-value sorting ranks negative-capable metrics by magnitude without changing the displayed value