Guide
Algorithms
Watchlist.top computes list and chart values from market data, configured timeframes, and saved settings. Each metric has its own inputs, formula, and conditions that can make it differ from exchange UI numbers or third-party data. Understanding the logic behind each value helps interpret it correctly rather than treating it as a black box.
What this section covers
- P24 (24-hour price change): calculated as (current price − price 24 hours ago) / price 24 hours ago × 100. Uses a rolling 24-hour window, not a fixed UTC day boundary. Will differ from exchange "24h change" if the exchange uses a different window or reference point.
- V24 (24-hour volume): the sum of trade volumes over the last 24 rolling hours in the quote currency. Uses the same rolling window as P24. Exchange totals may differ due to different window boundaries or volume filtering.
- NATR (Normalized Average True Range): ATR(n) / current price × 100, where n is the configurable candle count (default 14). ATR measures the average range (high − low and gap from previous close) over n candles. Dividing by price normalizes it so it can be compared across instruments at different price levels.
- PΔ (price change in selected interval): calculated as (latest candle close/current price − latest candle open) / latest candle open × 100 on the timeframe selected in Settings → Common → Price change. A positive value means the candle is above its open; a negative value means it is below its open.
- Pavg (average price change per candle): the arithmetic mean of the absolute price change from open to close for each of the last n candles on the selected timeframe. Reflects typical per-candle volatility for that instrument on that timeframe.
- VR (relative volume): current period volume / average volume over the last n periods on the selected timeframe. A value of 1.0 means current volume equals the configured average. Values above 1 indicate above-average activity.
- rBTC (price correlation with BTC): shows how synchronously the coin moves with BTC. The app compares percentage price changes on each candle over the selected timeframe and candle count. Values near 1 mean the coin usually moves with BTC, near −1 mean it usually moves against BTC, near 0 mean there is no clear connection in that window.
- Funding: the current futures funding rate, stored as a decimal rate and displayed as percent. The list column F shows the current rate, while the tooltip also shows the time until the next funding event when the exchange provides it.
- OI (Open Interest): the current total size of open futures positions for the instrument. The base value is the open position amount in the base asset; the quote value is the same position size converted to the quote coin when mark price or exchange value data is available.
- OI change: (current OI value − OI value at the selected comparison point) / OI value at the selected comparison point × 100. The comparison point is 1h, 12h, or 24h before the current value, depending on the setting. If "Calculate change in base coin" is enabled, the formula uses base OI. If it is disabled, it uses quote-value OI.
- Why base and quote OI change can diverge: quote-value OI includes price movement. If OI grows in base units while mark price falls enough, base change can be positive while quote change is negative.
- TA (absolute trades): the current trade-count window. For Binance, it is built from one-minute kline trade counts. The 1m window updates from live 1-minute kline deltas every 10 seconds; 5m, 15m, and 1h sum the last 5, 15, or 60 one-minute candles and update every minute.
- TR (relative trades): (current rolling trade count − average trade count) / average trade count × 100. The average uses the configured number of previous windows for the selected trades window and excludes the current window.
- Levels (support and resistance): price zones where the candle series revisited a price area at least the configured number of times within the allowed percentage difference. The application marks these zones on the chart and uses the nearest one to compute percentage distance in the level columns in the list.
- Level columns (default h1, h4, d): the percentage distance from the current price to the nearest confirmed level on the selected timeframe. Formula: |current price − nearest level price| / current price × 100.
- Orderbook threshold volume: in auto mode, derived from the statistical distribution of order volumes in the current orderbook snapshot — the threshold separates common orders from outliers. A global custom threshold in Settings can replace the automatic value, and a per-coin threshold edited in the orderbook header overrides both.
- Impulse alert: calculated on 1-minute candles. The app compares the latest close with the close from the configured period ago and triggers when the absolute percentage move reaches the configured threshold.
- Large print alert: calculated from live trades as price × quantity in the quote currency. One trade can trigger when it reaches the configured minimum volume and the alert is outside cooldown.
- Print burst alert: live trade quote volume is summed inside the configured rolling window. The alert requires both minimum quote volume and average-volume comparison: current-window volume must be at least the average same-window volume from the average-volume period multiplied by the configured multiplier. Optional direction detection compares buy and sell volume and marks the dominant side when it reaches the configured threshold.
- Chart patterns: the app scans configured timeframes, assigns each detected pattern a score, then applies minimum score, maximum age, maximum distance from current price, and confirmed-only filters before drawing the best match.
Key screens and controls
- Coin list showing P24, V24, OI, F, NATR, PΔ, Pavg, VR, and level-distance columns side by side.
- Chart with a confirmed level line and the corresponding level-distance value visible in the list.
- Chart showing ATR calculation context: several candles with visible high-low ranges.
- Settings → Common tab with NATR candle count highlighted.
- Settings → Common tab with VR timeframe and count highlighted.
- Event notifications → Impulse and Print activity settings.
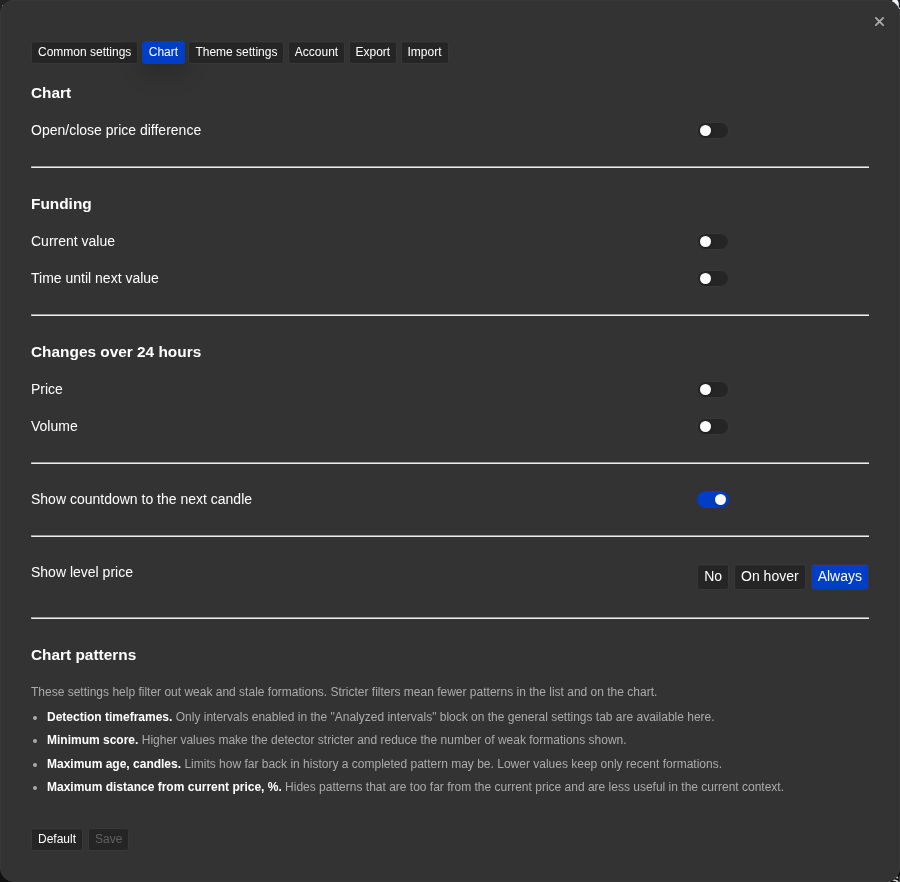
- Settings → Chart tab with chart patterns settings highlighted.
Step-by-step flow
- This is the reference point when a metric value seems unexpected or when Watchlist.top numbers differ from exchange data.
- To understand why P24 or V24 differs from the exchange display, check whether the exchange uses a fixed UTC daily boundary versus a rolling 24-hour window.
- To understand PΔ, check the configured Price change timeframe in Settings → Common and compare the latest candle open with its close or current price.
- To understand why NATR seems high or low, check the configured candle count in Settings → Common. Fewer candles react faster to recent volatility; more candles smooth out the average.
- To understand a VR value, remember that the baseline (average) uses the lookback count and timeframe configured in Settings → Common. The same coin on different timeframes will produce different VR values.
- To understand TA or TR, check the trades window in Settings → Common. The trades window is independent from the chart timeframe buttons and from the common analyzed intervals.
- To understand Funding, check whether the F column is enabled and whether the instrument is a futures instrument. Read the value as a percent funding rate, not as a price-change percentage.
- To understand OI, check Settings → Common → Open interest. Confirm whether the cell is set to Value or Change, which comparison period drives coloring, and whether Value or Change is using base coin or quote coin.
- To understand a value in the distance-to-level columns (default h1, h4, d), open the coin chart and look at the nearest level line. The distance you see visually corresponds to the percentage distance from price to level in the list.
- To understand an impulse event, check the configured period and percent threshold in Event notifications → By parameters → Impulse.
- To understand a print activity event, check the selected scope, side filter, cooldown, and whether Large print or Print burst produced the event.
- To understand why a chart pattern is or is not drawn, check Settings → Chart: enabled timeframes, minimum score, maximum age, maximum distance, and confirmed-only mode.
Screenshots

P24 and V24 in the coin list with a rolling-window note
P24 and V24 use a rolling 24-hour window, not a fixed daily boundary.
NATR column with the settings that drive it
NATR in the list is tied to the candle count setting in Settings → Common.

VR above 1 for a coin with unusual activity
A VR value above 1 means current volume is higher than the configured average.
Level-distance value matched to the nearest level on the chart
The level-distance column and the nearest level line on the chart describe the same distance.

Orderbook with auto threshold versus custom threshold
Auto and custom thresholds can produce different order highlighting.
Operational notes
- All formulas use market data that Watchlist.top has already received and processed. The freshness of each metric depends on the update cadence for that data type.
- Rolling 24-hour windows mean that P24 and V24 change continuously, not just at midnight. Comparing to exchange UI that uses fixed daily boundaries will always produce slight differences.
- NATR and ATR react to the candle count setting. A lower count (e.g. 5) makes the metric react quickly to recent candles; a higher count (e.g. 50) smooths the value over a longer history.
- VR requires enough historical data for the lookback period. If the coin has recently been added or the lookback period is longer than available history, the value may be less meaningful.
- TA and TR currently use Binance trade-count data. Bybit and OKX require separate live trade aggregation before the same metric can be shown reliably for those exchanges.
- Funding values are cached briefly and refreshed while the list is active. They should be read as current funding context, not as a tick-by-tick stream.
- OI updates while the OI feature is enabled and the list is active. Read it as a current market-state metric, not as a tick-by-tick feed.
- If OI change is empty, the current value may exist but the selected past comparison point may not exist yet. This is expected after enabling OI, especially for exchanges without preloaded OI history.
- Base OI change and quote OI change can show opposite signs. Example: OI changes from 1,000 SOL to 1,100 SOL, while mark price changes from 100 USDT to 80 USDT. Base change is +10%, but quote value changes from 100,000 USDT to 88,000 USDT, so quote change is −12%.
- The 1h trades window is a rolling sum of the last 60 one-minute candles. It can differ from the number of trades in the currently open exchange 1h candle because the boundaries are rolling.
- rBTC changes with the timeframe and window length. A coin moving closely with BTC on the 1h timeframe may show a weaker connection on the 1d timeframe.
- Levels are confirmed zones, not single candle touches. The confirmation count (how many times the area is revisited) and the allowed price difference (how close is "the same area") both affect what qualifies as a level.
- Impulse uses 1-minute candle data and is intended for short moves. It is not the same as a higher-timeframe trend detector.
- Print activity depends on live trade streams. If you monitor the whole list, browser and exchange stream load grows with the number of selected symbols.
- Chart pattern results are filtered, not guaranteed predictions. A higher score means a better match to the detector rules, not certainty that the market will follow through.
When to use it
- When you want to understand exactly how a displayed value is calculated before relying on it.
- When a metric value looks different from what the exchange shows and you need to understand why.
- When you need to check the input window, data source, or update frequency a specific metric uses.
When not to rely on it
- If you just need to find where a setting or button is — check the reference section instead.
- If you are new and still getting started — the quick-start guide is a better first step.
Typical interpretation mistakes
- Looking at a metric value without checking the time window and update frequency behind it.
- Assuming the same label — like "volume" or "rBTC" — means the same thing in every context.
- Trusting a value because it looks plausible without checking edge cases and known caveats.
Algorithms and formulas to understand
- P24 = (price_now − price_24h_ago) / price_24h_ago × 100 — rolling 24-hour window
- PΔ = (latest_candle_close_or_current_price − latest_candle_open) / latest_candle_open × 100
- Pavg = mean(abs(candle_close − candle_open) / candle_open × 100, last n candles)
- NATR = ATR(n) / price_now × 100, where ATR(n) = mean of true ranges over n candles
- VR = volume_current_period / mean(volume, last n periods)
- funding % = funding_rate × 100
- OI quote value = open_interest_base × mark_price when the exchange does not provide quote value directly
- OI base change % = (OI_base_now − OI_base_then) / OI_base_then × 100, where then is 1h, 12h, or 24h before now
- OI quote change % = (OI_quote_now − OI_quote_then) / OI_quote_then × 100, where quote OI is exchange quote value or base OI × mark price
- TA = sum(number_of_trades, selected rolling window): 1m uses live 10-second deltas; 5m/15m/1h use the last 5/15/60 one-minute candles
- TR = (TA_current_window − mean(TA, previous n windows)) / mean(TA, previous n windows) × 100
- level column value = |price_now − nearest_level_price| / price_now × 100
- rBTC = how synchronously the coin moves with BTC; the app compares percentage price changes on each candle over the selected timeframe and candle count
- Level confirmation: a price zone qualifies as a level if it is revisited at least count times within allowed_diff % tolerance
- Impulse % = |close_now − close_period_start| / close_period_start × 100 on 1-minute candles
- Large print quote volume = trade_price × trade_quantity
- Print burst triggers when sum(quote_volume, current_window) >= min_quote_volume and sum(quote_volume, current_window) >= mean_window_quote_volume(average_volume_period) × average_multiplier; optional direction = dominant buy/sell volume share if it reaches the direction threshold
- Chart pattern selection filters by timeframe, score, age, distance, and confirmation, then picks the strongest matching pattern