
Reference
This is a quick lookup for controls that appear in multiple parts of the product. It helps when you know what control you need but cannot remember where it lives or exactly what it does. Each entry gives the location, what the control changes, and any conditions that affect its availability.
What this section covers
- List header controls: current list name (click to open list manager), sort column arrows (click column header; optional absolute-value sorting adds extra sort states for negative columns), search bar (narrows visible rows without changing list composition), favorites star (click to mark a coin and assign a color), row/cell selection (selects the coin and copies the exchange ticker on desktop), and column visibility controls including optional OI and F columns.
- List manager elements: control tab (to switch, create, change, open in a new window, delete), export tab (to select lists and additional related data), import tab (to strictly check the export file Watchlist.top, then select lists and related groups).
- Chart controls: ticker and market, candle statistics, candles/bars, timeframes, indicators, grid manager, zoom and Reset zoom, All charts, fullscreen, and optional values from Settings → Chart. Drag the time or price scale to change it; double-click the price scale to restore auto-scaling.
- Drawing tools: signal level/ray, price level, beam, Fibonacci level, parallel lines, price channel, clips, rectangle, 3/5/8 wave, note, volume profile, line, figure removal, magnet, duplication and color mode. Without a magnet, points are placed between the candles and the right of the latter; the signage mode, background, size, position and radius of the control points are set in Settings → "Chart".
- Orderbook panel controls: bid/ask rows with volume in base and quote, optional 5% imbalance rows, percentage distance column, base/quote threshold values in the header (click a threshold value to enter a custom per-coin override, × to reset), the entire panel shows only orders within ±5% of the current price.
- The notification window elements are a single local tape of up to 200 events with filters by type and tab "Settings". In the settings there are "Price" (active/inactive server alerts) and "Complex" with "Impulse" and "Transaction Stream": large print, volume surge and print surge.
- Settings tabs: Common, Presets, Hotkeys (desktop), Chart, Integrations (desktop), Theme, Account, Export, and Import. Hotkeys supports search, capture, clearing, conflict detection, per-action reset, and reset all. Integrations supports Tiger.Trade, MetaScalp, and Vataga. Theme includes Default dark/light, GitHub Dimmed, Catppuccin Mocha, Nord, Dracula, Solarized Light, and manual colors.
- The mobile cap switches "Notifications", "List", "Chart", "Stacan", the map of large applications and "All charts". In "All charts" there is a timeframe, metric, direction, manual update and a sixth with the number of graphs, signatures, visibility and color of the parameters.
- Android Back: First closes the top dialog, then returns the mobile screen history, then the WebView history, and only then completes the app.
- Desktop dialog elements: the key with the saved key can be moved and changed in size at the edges or angles; the size and position are stored locally for this browser.
- Downloading the app: the item "Application" in the landing menu and the product description dialog give a versioned link Android APK app_<version>.apk from watchlist.top.
Key screens and controls
- List header with sort arrows, search bar, and favorites star in a typical working state.
- Chart controls with chart type, timeframes, drawing tools, indicators, grid, zoom, All charts, and fullscreen.
- Drawing toolbar with all figure buttons and the magnet button visible.
- Chart with optional chart info values and an automatic pattern overlay visible.
- Orderbook panel showing the bid and ask sides with the distance column and the volume edit state.
- A notification window with a single filtered tape and settings "Price" / "Complex".
- List manager showing Manager, Export, and Import tabs.
- Settings dialog showing Common, Presets, Hotkeys, Chart, Integrations, Theme, Account, Export, and Import tabs.
Step-by-step flow
- Find the control name in the list above and read its description to understand where it is and what changes when you use it.
- For deeper explanation of any control, follow the link to the relevant task-oriented section (Lists and workspaces, Chart and drawing tools, Settings, etc.).
Default keyboard shortcuts
List navigation and search
Chart timeframe and scale
Layout and symbol actions
Drawing, alerts, and help
Screenshots
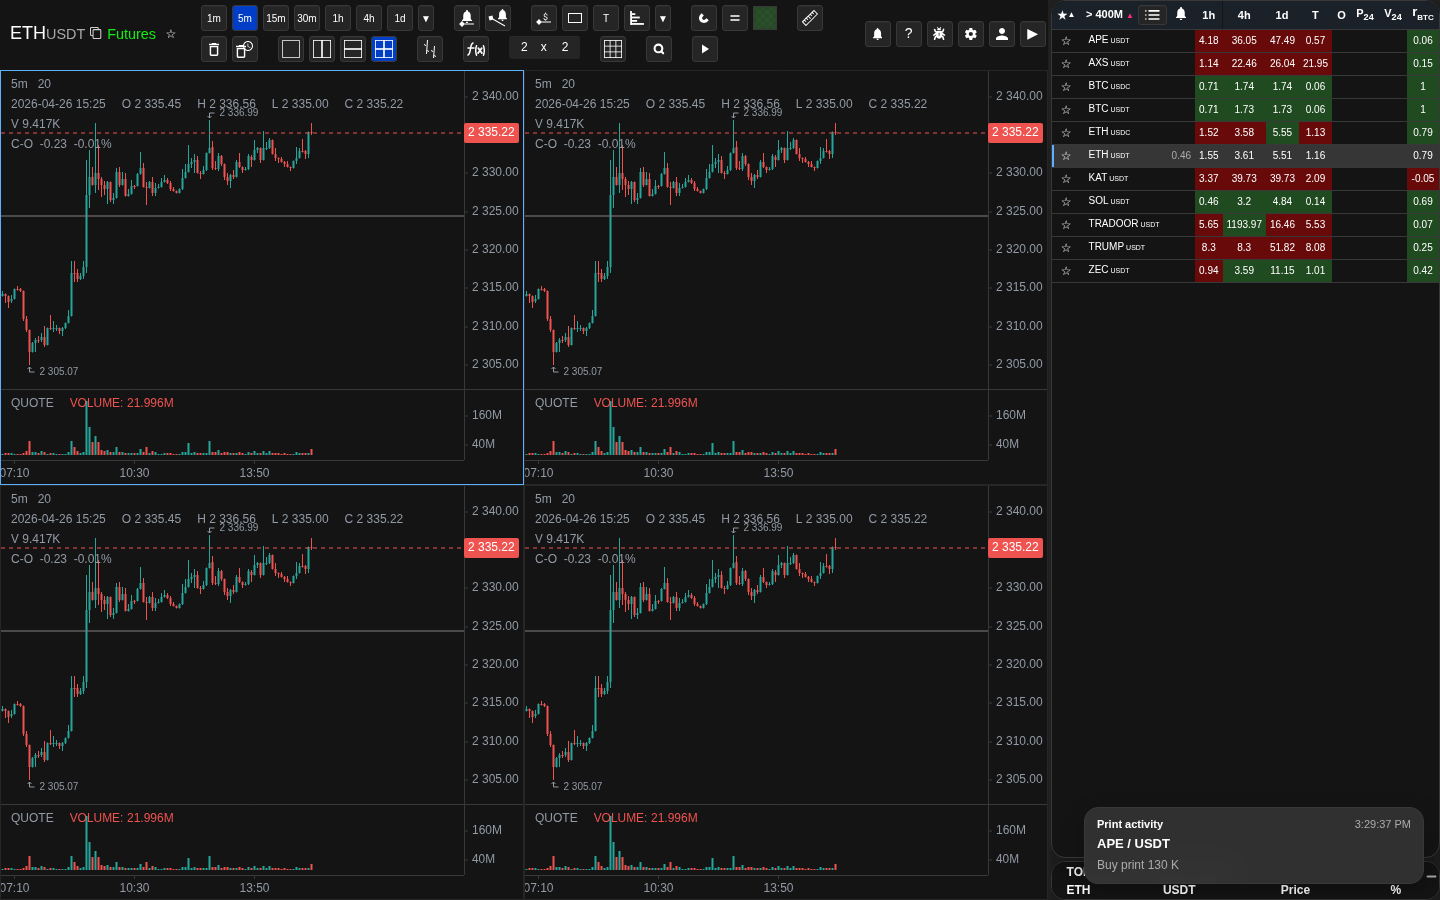
Annotated list header with all control labels
This annotated screen labels each visible control in the list header: list name, sort arrows, search bar, favorites star.
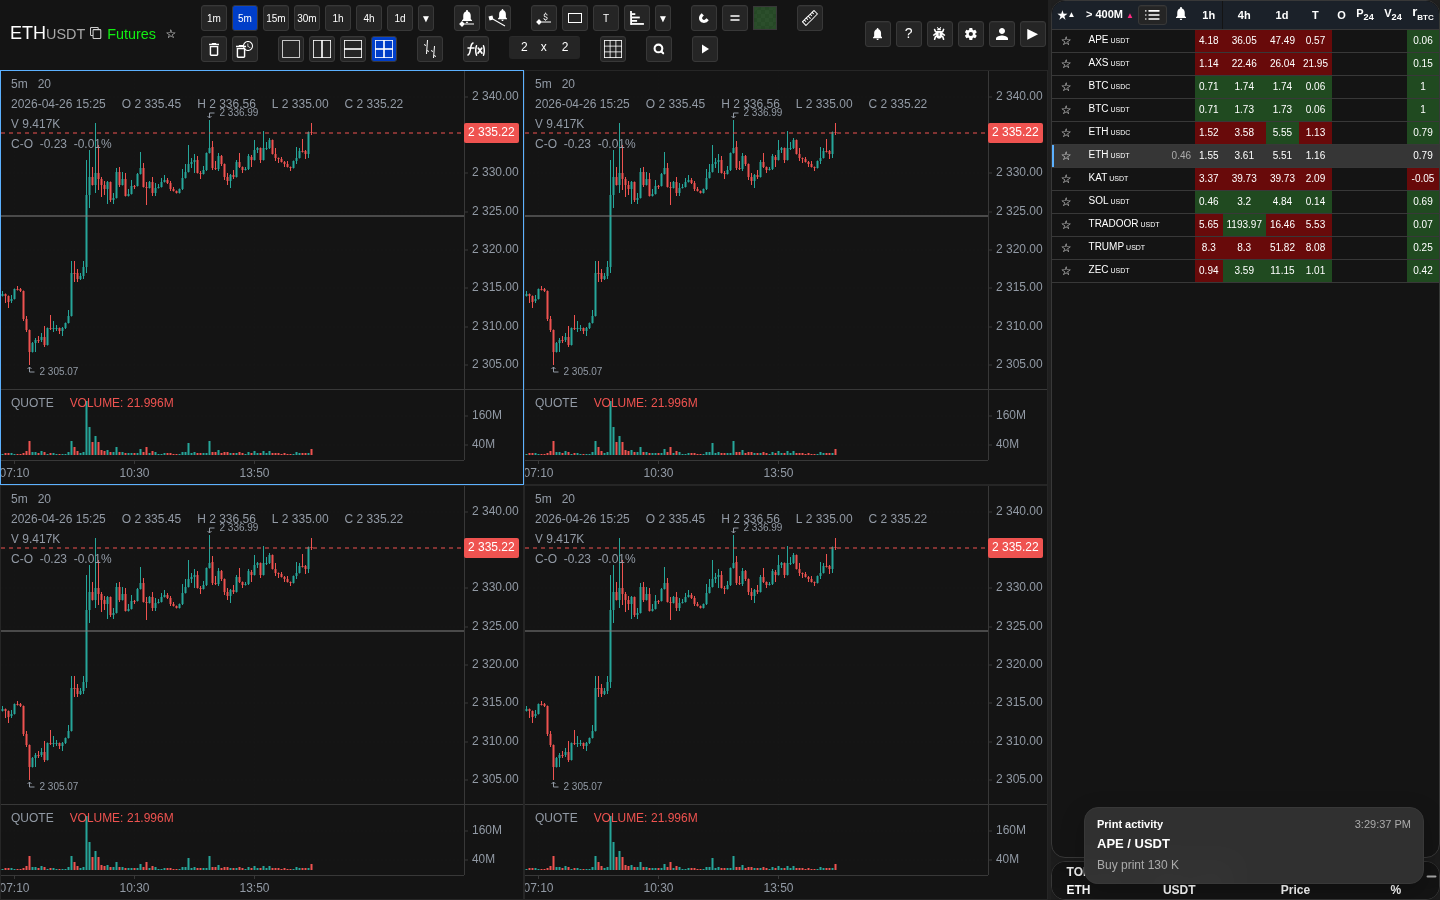
Annotated chart header with all button labels
This annotated screen identifies the chart type, timeframes, drawing controls, indicators, grid, zoom, All charts, and fullscreen.
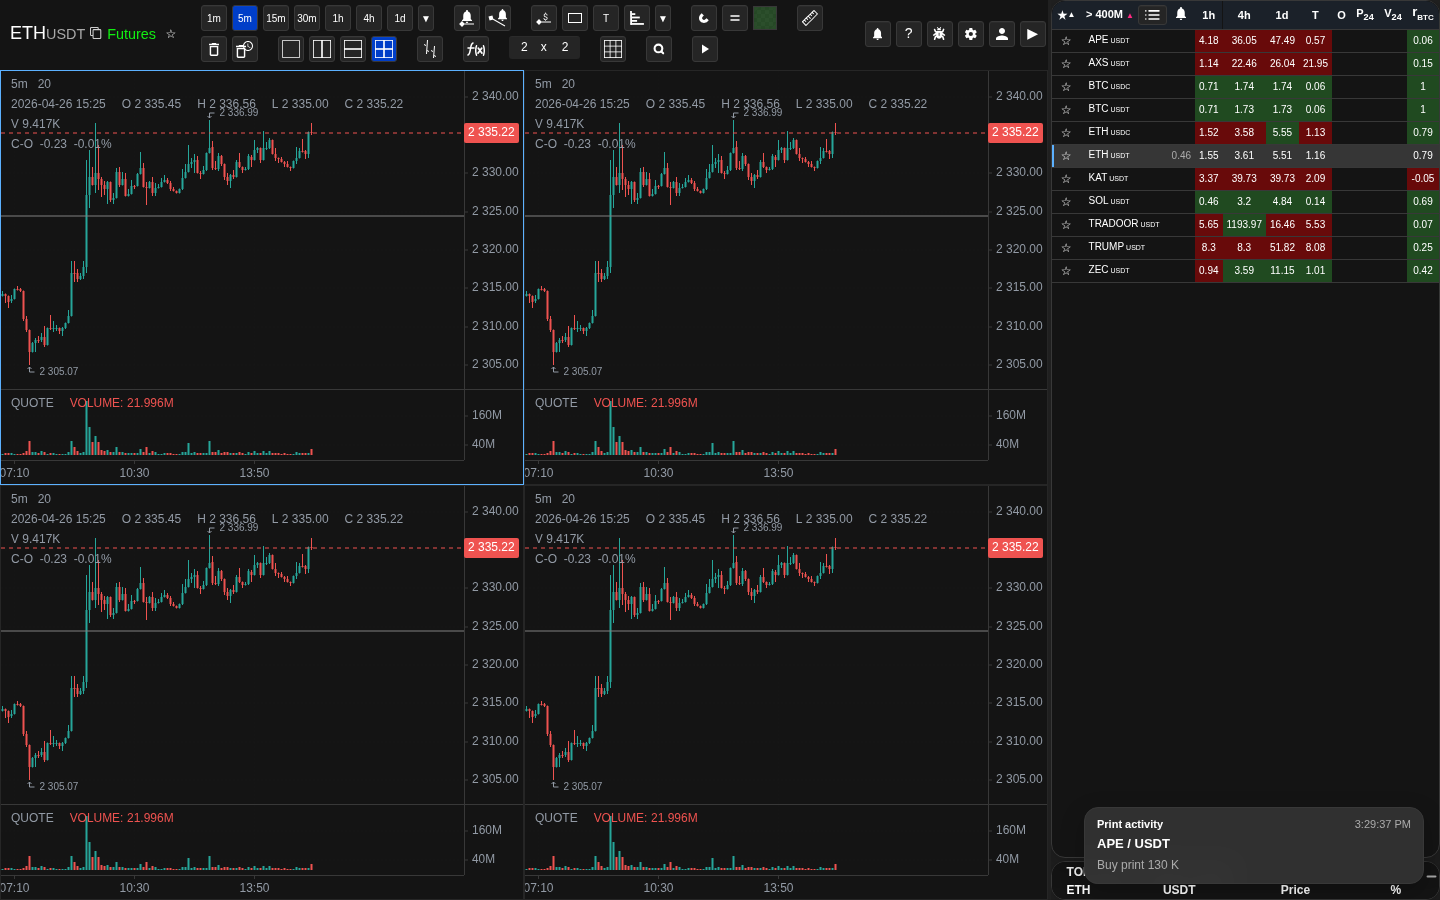
Annotated drawing toolbar with tool names
This annotated screen labels each drawing tool button and the magnet states so users know what each button activates.
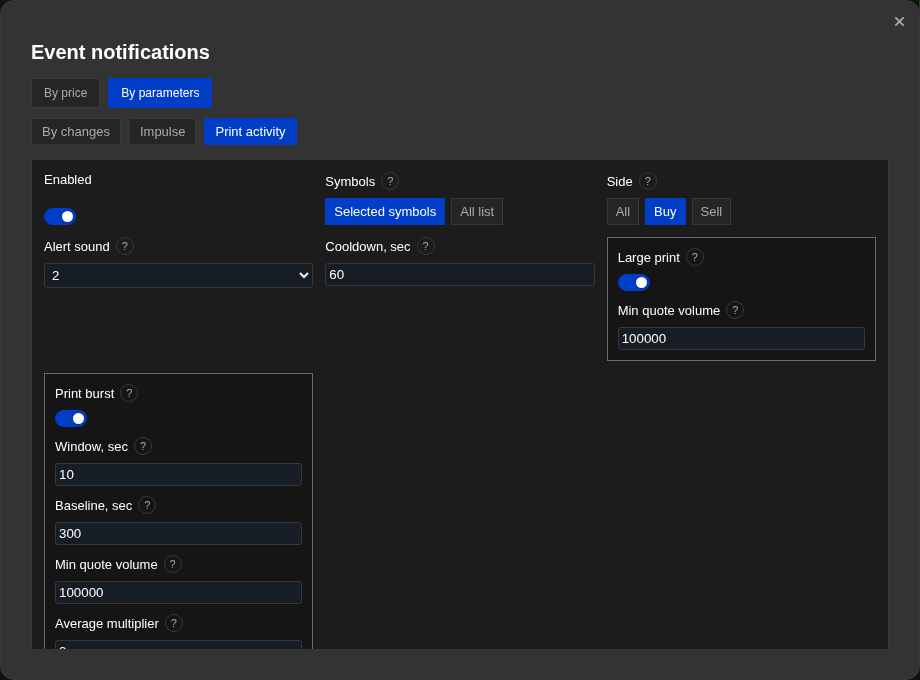
Notifications window with both tabs visible
A single tape with filters and settings of "Price" / "Complex", including "Trade flow is displayed on the screen.
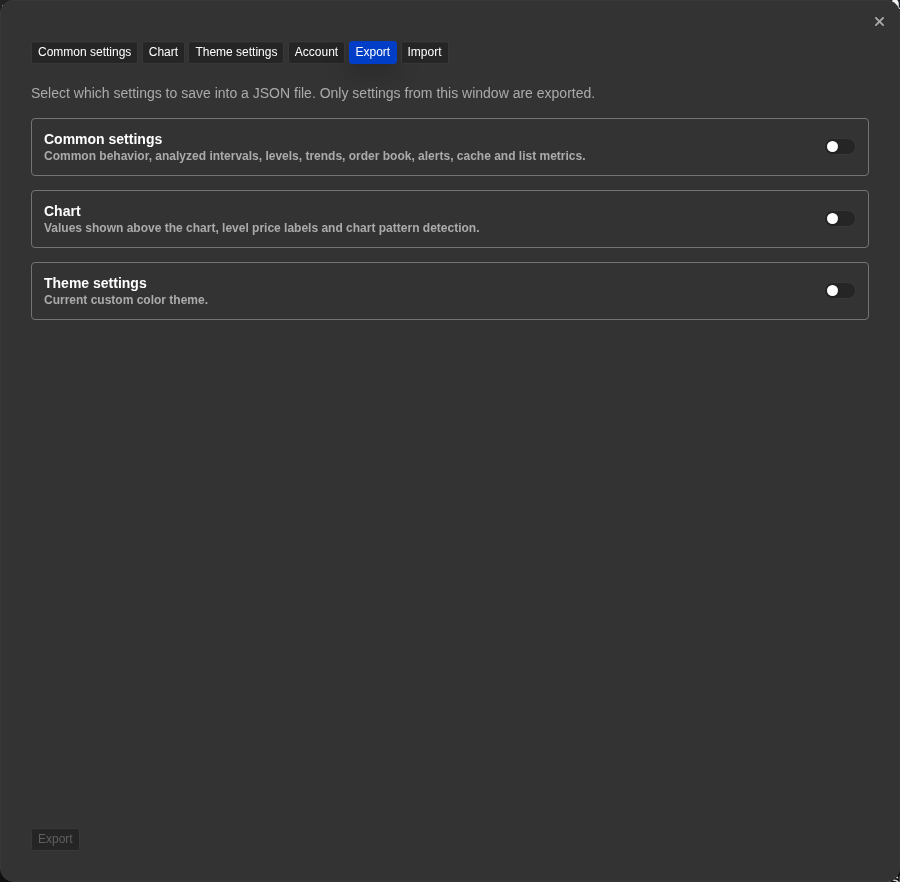
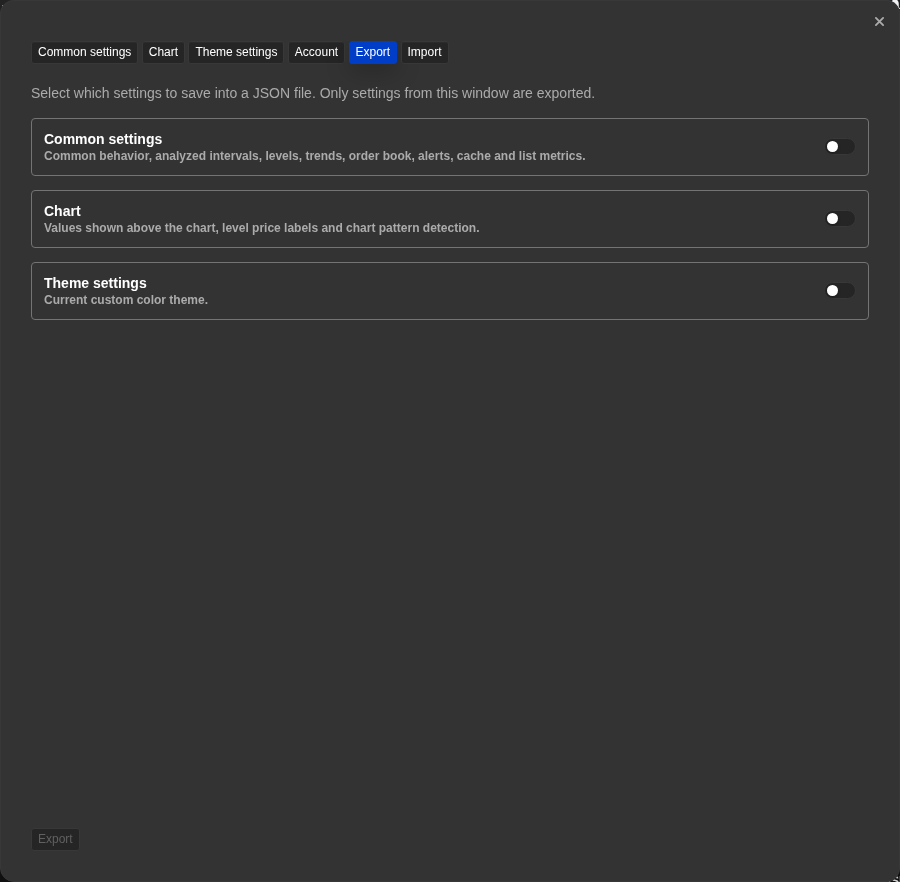
Transfer tabs in Settings and List manager
Settings transfer and list transfer live in separate places and expose different selectable groups.
Keyboard shortcuts reference table
The shortcut table keeps key combinations in the left column and actions in the right column, grouped by navigation, chart, drawing, and alerts.
Operational notes
- The reference covers control locations and short descriptions. Workflow explanations, step-by-step instructions, and formula details live in the dedicated sections.
- The shortcut table lists defaults. On desktop, Settings → Hotkeys lets you search actions, replace or clear a binding, detect conflicts, and reset one action or all actions; tooltips show the current binding.
- Some controls are only visible in specific modes: the top-list interval selector is only shown in list mode; the grid manager is only available when a grid is open.
- When absolute-value sorting is enabled, headers of supported negative columns cycle through four states: descending, descending by absolute value, ascending, ascending by absolute value. The current state is shown in the column tooltip.
- On desktop, selecting a coin from the list by click or with ↑/↓ also copies the exchange ticker to the clipboard.
- The price axis is interactive: dragging it vertically locks the vertical scale manually. Double-clicking the price axis restores auto-scaling. A locked scale can cause candles to disappear from view when switching to a coin with a significantly different price level.
- Import/export controls are account-state dependent. Settings import/export and list import are not available in demo and trial access states.
- Settings "Trade flow" depends on the current list because the rules, exceptions and coins selected are kept separately for each list.
- A single tape is needed to process the price, impulse, and flow events that work. It stores up to 200 records per user locally, synchronizes between tabs, but is not a server archive between devices.
- Dialog size and position are local UI preferences. They are not account-level strategy settings and can differ between browsers.
- The F column is optional and controlled from Settings → Common. It shows current futures funding rate; the tooltip shows the rate as percent and time until next funding when available.
- The OI column is optional and controlled from Settings → Common. It can show current value or selected-window change for 1h, 12h, or 24h. In Value mode, quote/base changes the displayed unit. In Change mode, quote/base changes the percentage calculation basis.
- The List Gradient switch is in Settings → Theme → List. It controls intensity-based cell backgrounds for list metrics that use above/below price or positive/negative difference colors.
- On mobile, many desktop header controls move into the compact menu. This is expected and does not mean the feature is missing.
- On the mobile, "All charts" takes a picture of the metric values when opening, changing the metric or direction and when pressing the update.
- Android update prompts and manual app links use the versioned APK URL on watchlist.top, not a Telegram post link.
- New registration via Telegram or email includes a limited demo access.
- Import checks the settings and lists strictly for the entire file before recording.
- On the mobile pinch, the horizontal time scale changes, the main price panel automatically scales by default to the visible candles, the vertical drag scale includes a manual scale, the double-tap returns automatic.
- Important list columns also include Score, round numbers R_N, detected patterns, and optional exchange-account PnL. NATR is available both as a list metric and as a chart indicator.
- All charts means every coin in the active list in the current sort order; URL paths may still use the historical sorted-charts slug.
- Additional defaults: Esc cancel/close, Ctrl+B terminal, Ctrl+Z All charts, Home/End first/last, Page Up/Page Down pages, and hold Shift for the temporary ruler. Drawing actions without a default can also be assigned in Hotkeys.
- The "Hand" auto-sorting interval does not shift the graphics itself; the 2/5/10/30/60 second variants temporarily show "Pause" during scrolling, gestures, drawing and open panels.
When to use it
- When you already know what feature you need and just want to find the exact tab, button, or dialog quickly.
- When you need a quick lookup without reading through a full workflow explanation.
When not to rely on it
- If you need onboarding, formula explanations, or troubleshooting with multiple dependent steps.
- If your question needs a narrative explanation rather than just a location.
Typical interpretation mistakes
- Using reference snippets instead of following the full workflow when a step-by-step approach is needed.
- Assuming that knowing where a control is also explains what it does and when it is available.
- Forgetting that some controls are conditionally unavailable depending on mode, market, or account state.
Algorithms and formulas to understand
- Why some controls are contextual and only appear in specific application modes
- Why account state gates certain controls (delivery channel options, trial CTA)
- Why transfer controls can be disabled in demo or trial state
- Why the Transaction Stream settings are in the current saved list
- Why Funding in the list and Funding on the chart are configured separately
- Why Open Interest display mode changes the list cell and sort value without changing the underlying futures OI data
- Why the List Gradient switch affects cell intensity but not the numeric values shown in the list
- Why absolute-value sorting changes only row order and not the displayed metric value
- Why list navigation can copy the exchange ticker without changing the normal selected-coin workflow
- Why dialog geometry is saved locally per browser rather than as account-level trading settings
- Why mobile mode "All charts" uses explicit order updates and keeps position when switching to a regular schedule
- Why is strict import verification done entirely before recording and keeping the default settings
- Why does Android Back first close the dialog and go through the screen history instead of completing the app right away?
- Why do links to the Android app lead to the APK files that are being updated
- Why does mobile use compact navigation instead of displaying all the desktop elements at once