watchlisttop
bug reports
watchlist_top
news, updates
watchlisttop
bug reports
watchlist_top
news, updates
Crypto screener for active markets on Binance, Bybit and OKX
When it can be useful
It can be used as an additional tool for monitoring and scalping: finding active coins, checking open interest, funding, large limit orders, print activity, chart patterns, and price reactions around levels and trend lines.
Login and identification in the system
To log in the app, you need to get a link in the telegram bot chat @WatchlistTopBot. When you first log in, a user account is created.
For this you need:
- open bot chat @WatchlistTopBot,
- press the "Start" button - this is done once at the first login,
- in the chat menu, select and click the "Get auth link" button,
- copy the received link and follow it in the browser.
Important! If the link is received from different telegram accounts, then in the application it will also be different accounts. Therefore, to work in the future, you need to select and remember from which telegram were the authorization and subscription.
How does it work
For work, the public API of the cryptocurrency exchanges is used. Coins from the spot and/or futures market can be selected for tracking.
For futures markets, the list can show open interest, open interest change, funding rate and time to the next funding. These values help identify where new risk appears, where the market is overheated, and where activity is concentrated.
All user settings (drawn custom figures, set sound notifications about price levels, currently selected timeframe, chart display mode, currently selected coin) are saved on the server and can be accessed from any device after authorization.
Read-only exchange account keys can also be connected. The app uses them only for reading account data: open positions, limit orders, trades and closed positions can be displayed on the chart.
The Settings tab “Presets” contains ready-made parameter sets for different trading scenarios, each described in the guide: momentum scalping, level breakout, reaction from a level or large order, OI/Funding overheat, and pattern filtering.
In the desktop web version, you can select Tiger.Trade or MetaScalp and open the ticker from the list directly in the terminal. Clicking a ticker or any cell without a dedicated action also copies the exchange ticker to the clipboard.
App modes
List mode
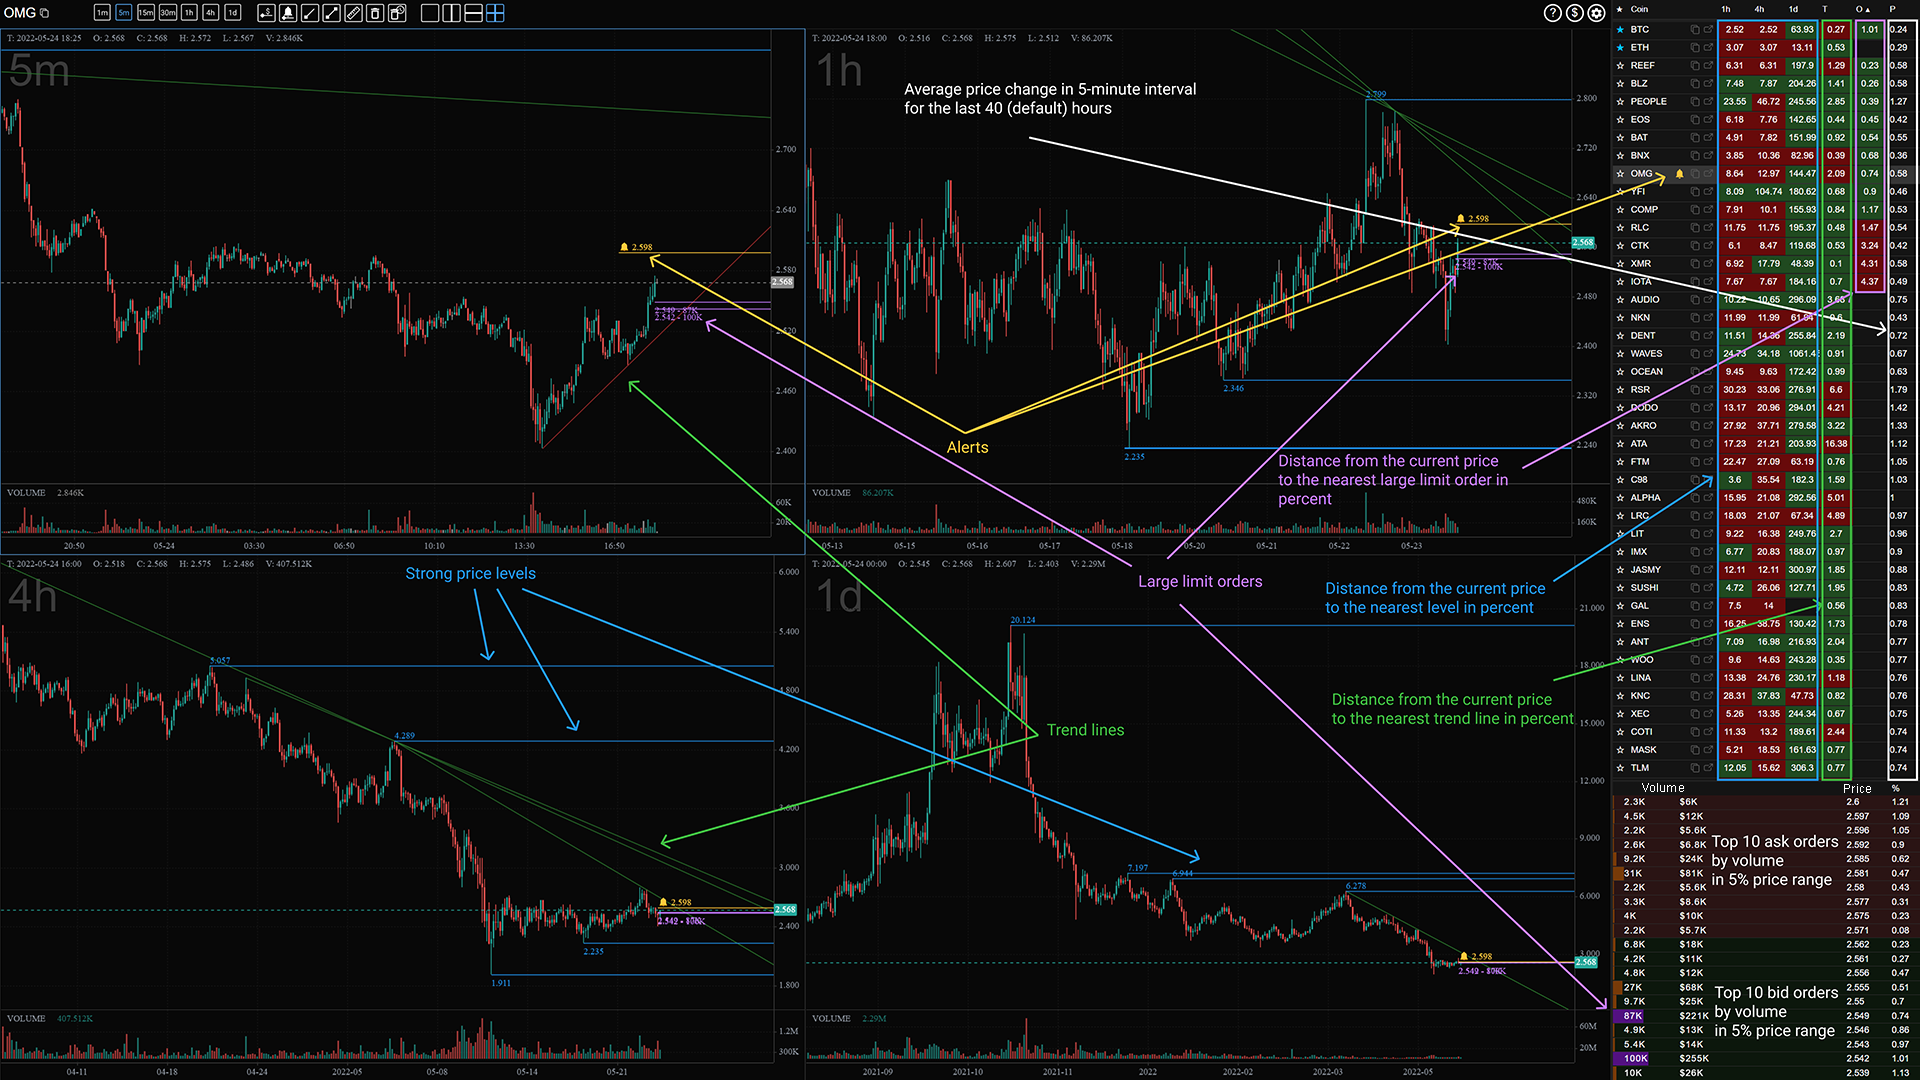
In the list mode, charts, a coin list and TOP orders by volume are displayed in one window.
Grid mode
In grid mode, only charts (one or more coins) are displayed in one window. This mode can be used to monitor a selected small list of coins for the current trading session.
Single coin mode
A window in single coin mode opens when you click on a link from the list of coins. Each coin has its own individual address. In this mode, it is possible to display charts of only one coin in one window.
Mobile top charts
On mobile screens there is a separate top charts view. You can choose a timeframe, sorting metric and number of charts on screen, then open the selected coin directly from the chart header.
Interface
Last 24 hours change screener
The 24h change screener is a table that is enabled when you click on the button next to the list name (three horizontal bars) or the plus button if no list has been created. Screener is designed to enable and disable coins in the list based on market data - price and volume dynamics by instruments, coin quotes, market (spot or futures).
The first time you turn on the app, all coins are disabled. It is necessary to select the necessary ones using filters, mark checkbox them and click the save button at the bottom of the table.
Important! Filters do not enable or disable coins. Filters only limit the selection of coins shown in the table. Only checkboxes are used to enable/disable.
The state of enabled/disabled coins is saved when working with filters.
At the bottom of the table, the current status is shown in the fields Total, Filtered, Total enabled. The values in these fields can be used to check if the coins have been included correctly.
For example, to disable all coins, you need to disable all filters (enabled filters are highlighted with a brighter color). If all filters are disabled, then the number of coins Total will be equal to the number of Filtered. If it's not, it means that some filter remained on.
As a result, after saving, the list will contain the number of coins specified in the Total enabled field.
List of coins
Coins in the list can be switched with the mouse or with the Up/Down arrow keys on the keyboard. When switching, the current exchange ticker of the coin is copied to the clipboard.
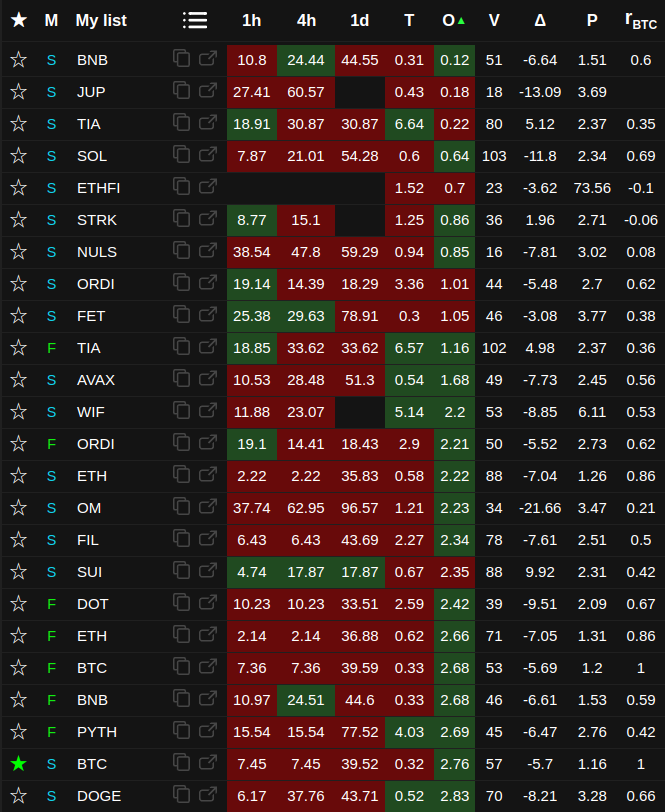
A table with a list of all coins in the right area of the window.
☆ Favorites - coins of interest can be added to separate lists (up to six)
E (exchange) - coin exchange: Binance, Bybit or OKX. If all coins are from one exchange, the column is not shown.
M (market) - spot or futures market, if all coins are from the same market, then the column is not shown.
🔔 - notifications. The column is displayed if at least one notification is set. The list shows the percentage distance from the current price to the nearest price for which the notification is set. Notifications are automatically duplicated in the telegram bot chat. You don't need to make any special settings.
Pattern icon - detected chart pattern and its timeframe. Supported patterns include Head and Shoulders, Inverse Head and Shoulders, Double Top, Double Bottom, ascending, descending and symmetric triangles, rising wedge and falling wedge. The tooltip shows the pattern name, quality score, confirmation and how many candles ago the pattern was completed.
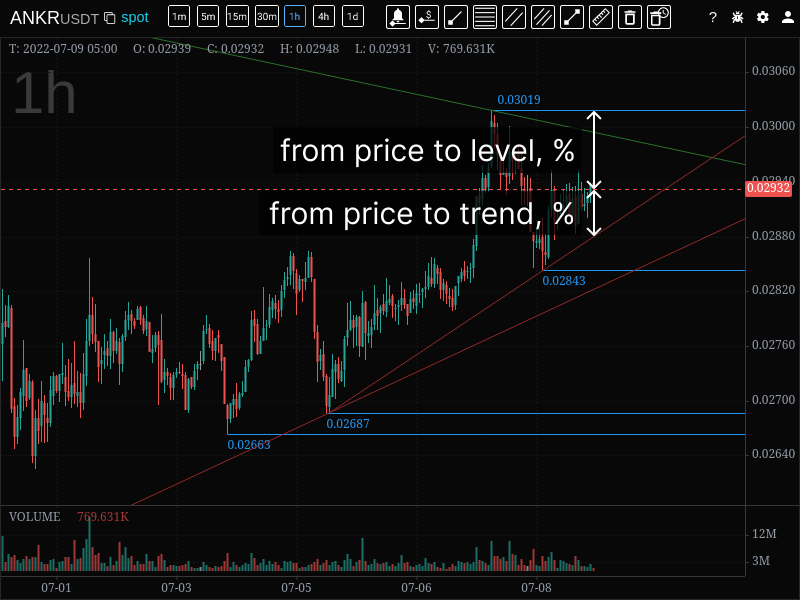
1h, 4h, 1d - percentage distance from the current price to the nearest level on the corresponding timeframe. Also can be enabled in the settings 15m, 30m timeframes. Sorting in ascending order is possible.
T (trend) - distance from the current price to the nearest trend line in percent. Sorting in ascending order is possible. By default, trends are tracked on all analyzed intervals. In the settings it is possible to disable / enable certain intervals. If all intervals are off, then the column is not shown in the list. If more than one interval is enabled, then on the first click it sorts by all timeframes, on the second and on the next clicks, the sorting is switched by the enabled timeframes in order (the timeframe is indicated next to "T").
O (order) - distance from the current price to the nearest large limit order in percent. Sorting in ascending order is possible. To determine whether the order is large, it is compared with a threshold volume specially calculated for each coin.
P24 - price change over the last 24 hours as a percentage. Sorting in ascending and descending order is possible.
V24 - volume in the quote coin over the last 24 hours. Sorting in ascending and descending order is possible.
NATR - normalized average true range for the last candle (it is possible to enable the NATR indicator for the entire chart). Sorting in ascending and descending order is possible.
The P24, V24 and NATR columns can be combined into one browser alert for the selected coin.
OI - futures open interest. The column can show the current value or percentage change for the selected comparison period. The value can be displayed in the base or quote coin, and the change can be calculated by base or quote value.
F - futures funding rate in percent. The tooltip shows the current value and time to the next funding.
VR (volume) - the difference between the volume of the
last candle and the average volume as a percentage. Calculated as:
(volume of the last candle - average volume) / average volume *
100%
Sorting in ascending and descending order is possible. The average
volume parameters are determined in the settings.
It is possible to set an alert if the volume exceeds the average value;
to do this, you need to click on the selected coin in the volume
column.
Notifications are delivered to the browser only.
PΔ - price change in percent for the last
candle in the interval selected in the settings.
Calculated as ((close - open) / open) * 100%
The indicator can be used to track price spikes on small timeframes.
If no interval is selected in the settings, the column is not shown in
the list.
It is possible to set an alert if the price has fallen or increased by a
percentage greater than the specified value; to do this, you need to
click on the selected coin in the price change column. Notifications are
delivered to the browser only.
Pavg - average price change in percent for the
selected timeframe for the specified period in settings (the period is
specified by the number of candles of the selected timeframe). For this
indicator, relative change for each timeframe is calculated as (high -
low) / low and then the average value is calculated as the sum of all
changes divided by the number of candles in the period.
If no interval is selected in the settings, the column is not shown in
the list.
The indicator can be used to assess the volatility of the instrument.
rBTC - correlation of the coin price with
the Bitcoin price for the timeframe and period selected in the settings
(the period is defined by the number of candles).
If no timeframe is selected in the settings, the column is not shown in
the list.
TA - number of trades in the current interval (candle). The timeframe can be changed in the settings.
TR - percentage difference between the number
of trades in the current interval and the average number of trades. The
timeframe and averaging period can be changed in the settings.
It is possible to set an alert if the difference exceeds the specified
value; click the selected coin in this column. Notifications are
delivered to the browser only.
Besides price levels, browser alerts are available for list parameters: P24, V24, NATR, VR, PΔ, TR, impulse and print activity. For print activity, you can track a large print or a burst of quote-volume over a window relative to the average. Triggered alerts are shown in a separate list, where they can be reviewed and cleared.
For columns that can contain positive and negative values, absolute sorting can be enabled. It helps find strong deviations regardless of direction.
TOP orders
Table below the list of coins. The table displays the 10 largest orders on each side (ASK, BID) from range +-5% of the price sorted by price. If there is a smaller number in this range, then all are displayed.
At the left edge of the table, a horizontal chart of order volumes is displayed, each column of which corresponds to the volume of the order at this price. Large volumes are highlighted in yellow and purple. Purple color highlights orders whose volume is greater than the threshold volume (also drawn as a purple price level on the chart).
The threshold volume can be calculated automatically based on the parameters specified in the settings, or it can be set its own value for each coin.
Auto calculation of threshold volume
If a fixed value is not set, then the threshold volume is calculated as the product of the average volume and multiplier specified in the settings. An example of the average volume values can be seen by setting the multiplier in the settings equal to 1.
Average volume is the average value of the volumes of all orders from the TOP, the volume of which is greater than the median value excluding extreme values.
If order book imbalance is enabled, the table shows an additional row with the total of all limit orders within 5% of price on each side. This is the visible liquidity in the range, not only large orders.
The order heatmap shows large limit orders from the coin list as bubbles. The closer a bubble is to the center line, the closer the order is to current price; bubble size depends on order volume.
Charts
It is possible to display one or more charts of one or more coins in one window.
The maximum number of charts in one window is determined by the screen resolution.
Support and resistance levels and trends are drawn automatically. Levels and trends crossed by the price change color to gray. Crossed levels and trends (gray) persist between sessions, by first click on button in the interface are deleted only for the current coin, on the second click they are deleted for all coins.
Drawing of several types of figures is available: segment, ray, price level, Fibonacci levels, price channels, rectangle, Elliott waves (3, 5 and 8 waves), volume profile, and text notes on the chart.
To delete a shape, right-click it. To delete all custom shapes at once, use the Trash button in the interface. On touchscreen devices, tap the Trash button (it turns red in delete mode), then tap the shape you want to delete. Tap the Trash button again to exit delete mode.
On the daily timeframe, only daily levels are displayed, on the four-hour - daily and four-hour, on the hour and less, all levels are displayed.
The levels of higher timeframes on the chart of lower timeframes are highlighted with a line thickness, for example, on an hourly chart, hourly levels are lines of 1 pixel thickness, four-hour levels are lines of 2 pixels, daily levels are 3 pixels.
Large limit orders are drawn with purple levels. The beginning of the order line is at the point at which the order was placed in the order book. If the order was placed before the app was launched, then the line starts from the moment the tool is turned on.
When a read-only exchange account is connected, the chart can show open positions, limit orders, trades and closed positions. Closed positions are displayed with entry and exit markers, a connecting line, price change and P/L in the quote coin.
If patterns are enabled, the detected pattern can be drawn on the chart of the selected coin. A custom price level label shows the price and the timeframe where the level was placed.
Chart overlay
Overlay lets you compare two coins in one chart. Each chart has a layers button in the top-right corner. Click it to enable overlay. The current coin moves to the background layer, and the main layer becomes empty for selecting the second coin.
Select the second coin from the list or via search — it will appear in the main layer above the background. Use the swap button to switch the layers. To turn overlay off, right-click the layers button — the background coin returns to the main layer and the overlay layer is removed.
Colors and opacity of the overlay chart can be adjusted in Theme settings.
Hotkeys
F1 - help
Esc - cancel drawing / close dialog box
← → - switching the timeframe of the selected chart
Shift + ←, Shift + → - switching the timeframe on all charts
↑ ↓ - switch between coins in the list; when switching, the current exchange ticker is copied to the clipboard
Tab - switching between charts if more than one chart display mode is selected
Ctrl + Z - switch between the regular list mode and top charts mode.
Home / End - in top charts mode, jump to the first / last chart.
Page Up / Page Down - in top charts mode, move one visible page of charts up / down.
+/- increase/decrease the chart scale
Shift + click on chart - measure tool
Mouse wheel click - activate the measure tool. Another mouse wheel click, Shift, or Esc turns the measure tool off.
Shift - cancel drawing mode, remove measure tool
F6 - first click - deleting crossed levels and trends of the current coin, second click - same for all coins.
F7 - drawing price alerts.
F8 - drawing price levels.
Shift + F9 - remove all price alerts.
Letters/numbers - ticker search
Ctrl + c - copy the ticker of the current coin.
Ctrl + o - opens the current coin in a new window in single coin mode.
Ctrl + b - opens the current coin in the selected terminal.
Ctrl + Delete - deletes the current coin from the list.
Ctrl + x - show/hide the list in list mode.
Hold Ctrl while drawing - temporarily enables weak magnet.
Hold Alt while drawing a segment or ray - snap the angle to the nearest 15° step.
Click a row in the coin list - selects the coin for display on the chart and in the order book (if enabled); the coin's exchange ticker is copied to the clipboard.
Right-click on a shape - delete the drawn custom shape.
Drag on the price axis with the left mouse button pressed - disables auto scaling and changes the chart scale on the price axis.
Double-click on the price axis - enables auto scaling.
Right-click in the list area - enable/disable auto-sorting.
Mouse pointer over the list - if autosorting is enabled, while the mouse pointer is over the list, autosorting is disabled.