Guide
Momentum scalping
Search for coins where price, volume, trades, and OI confirm an active move.
Disclaimer and responsibility
- The scenarios in this guide are educational examples, not financial advice and not a promise of profit.
- WatchlistTop can help structure market analysis, but every concrete trading decision is made by the trader.
- The trader is responsible for position size, leverage, stop placement, exchange risk, liquidation risk, and the consequences of each trade.
- Crypto assets and futures are high-risk markets. A strategy can produce losses even when all screener conditions look valid.
Market
Liquid spot and futures pairs. Futures provide extra context through OI and funding.
Timeframes
- List ranking: 5m, 15m, 1h context depending on the speed of the market.
- Entry chart: 1m or 5m for fast scalping; 15m for a slower intraday entry.
- Context chart: 1h to avoid entering directly into a strong higher-timeframe level.
Screener tools
- Columns "P24", "V24", "NATR", "TA", "TR" — enabled in Settings → General → Metrics section.
- Column "OI" — same location; mode and comparison period are configured inside the column settings.
- Column "F" (Funding) — same location, visible only for futures instruments.
- Charts by sorted list — TOP button in the header on desktop; top tab on mobile.
- Impulse alerts — Alerts → Impulse tab.
Basic setup
- Settings → General → Metrics. Enable "P24", "V24", "NATR", "TA", "TR". For futures lists also enable "OI" and "F".
- OI column settings: set mode to Change, comparison period to 1h for short-term moves or 12h for broader positioning. Set calculation to Quote currency — this includes price movement in the OI change value.
- Sort by "TR" to rank coins with the most unusual trade acceleration. Switch to "NATR" when you need the widest-ranging coins, or to "P24" for raw price movement. Use absolute sorting on "P24" to see strong moves in both directions.
- Settings → General → Level intervals: keep 1h, 4h, and 1d enabled. These levels appear on the chart and help avoid entries directly into a strong higher-timeframe barrier.
- Alerts → Impulse tab: set period to 5–10 minutes, change threshold to 1.5–2.5% for liquid perpetuals. Assign the alert to your working futures list — acceleration moves are noticed without manual monitoring.
- Chart settings (gear icon on the chart): enable Candle countdown and Funding display so remaining candle time and positioning cost are visible directly on the chart.
How to read the setup
- A stronger setup has price movement, volume, trade activity, and OI moving in the same direction of intensity.
- If price has already stretched far into a higher-timeframe level, wait for pullback or consolidation instead of chasing.
- Funding above 0.05–0.1% per 8-hour period is elevated for major pairs; above 0.2% is extreme. Long entries at these values need a tighter stop and smaller position size.
- A "TR" value above 1.5–2 means trade count is 1.5–2× the average for the selected period — this is a sign of real acceleration, not just a high price.
- If funding is extreme, reduce aggressiveness: the move can continue, but late entries become more fragile.
When to skip
- The coin is illiquid and moves only because of a thin orderbook.
- Price is directly at a strong higher-timeframe level and OI/funding already show crowded positioning.
- The move is visible only in price, while volume and trades are weak.
Risk management
- Use smaller position size when "NATR" is high: the same stop distance can be hit faster.
- Place invalidation behind the local structure, not at a random fixed percentage.
- Do not increase leverage because the signal looks strong. Momentum setups can reverse sharply.
Screenshots
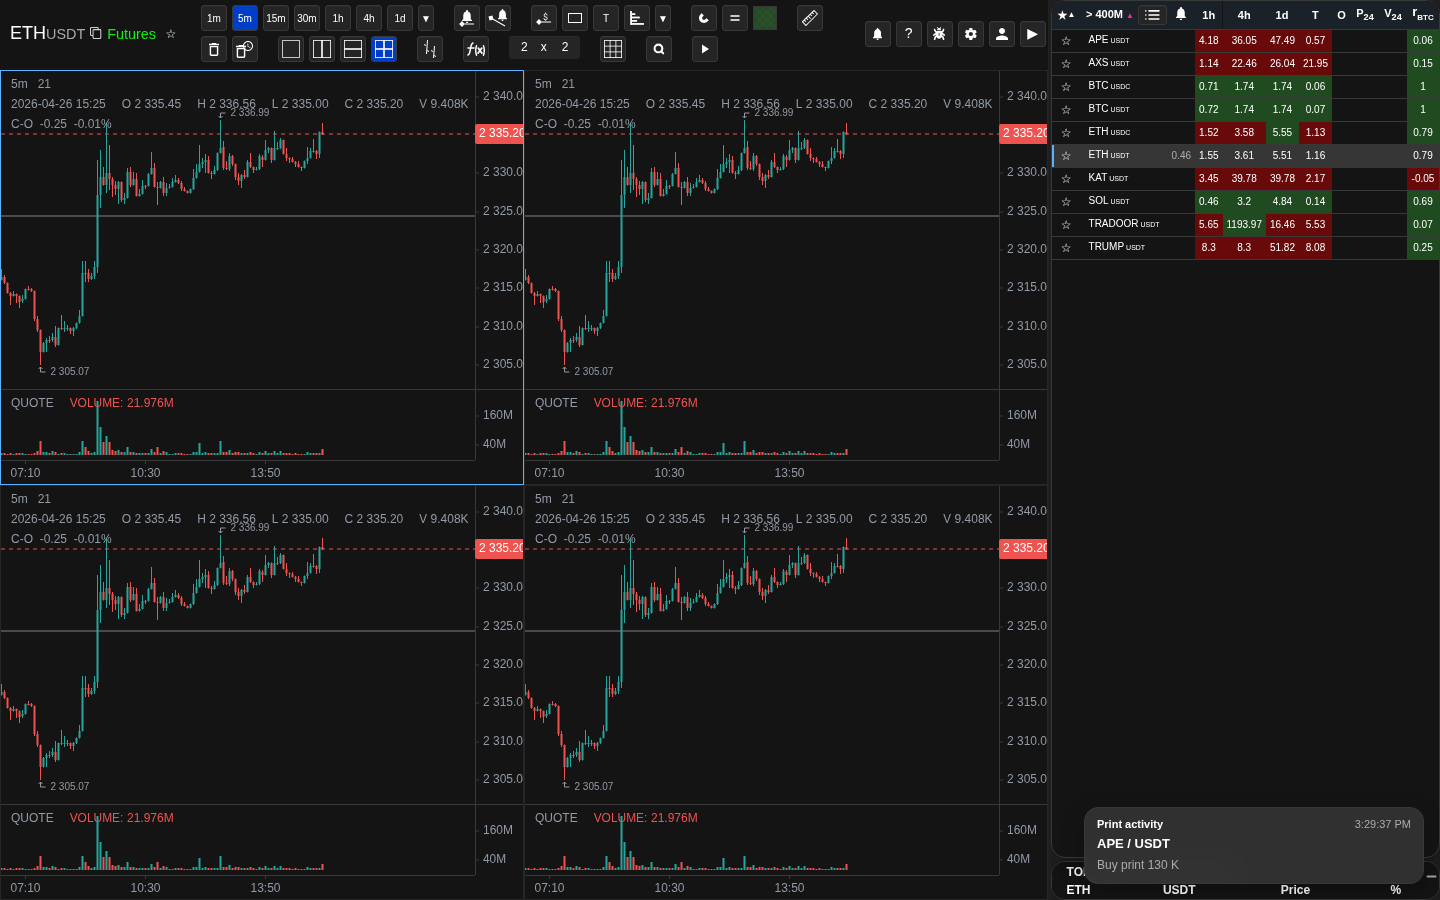
Ranking active coins
Use metric columns to bring active coins to the top before opening the chart.
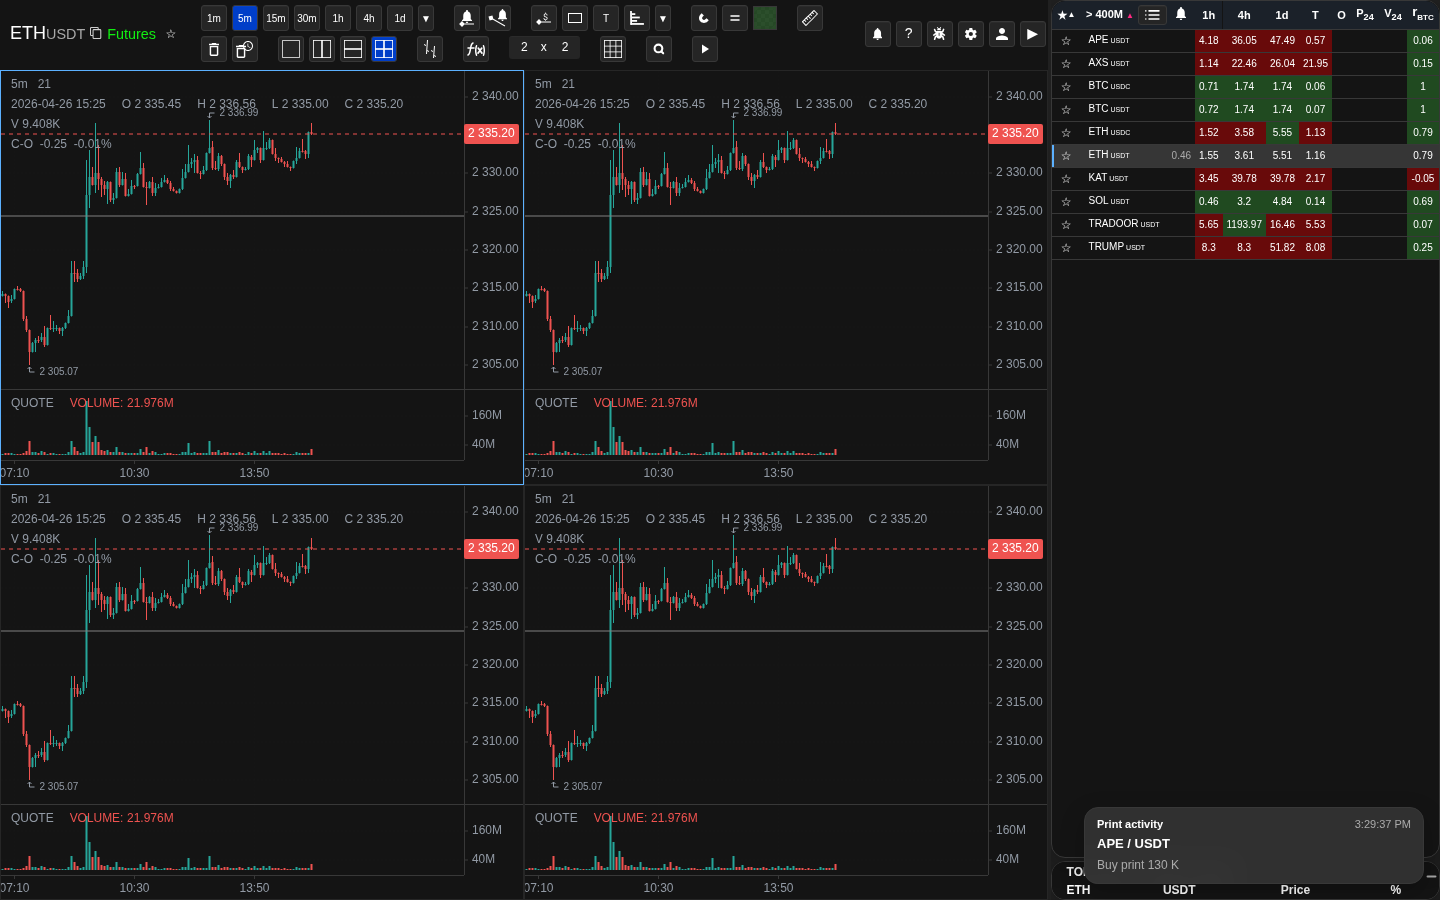
Volatility columns
NATR and related columns help avoid low-range instruments.