Guide
Level breakout
Trade a break of support, resistance, trend line, or liquidity area only when activity confirms the breakout.
Disclaimer and responsibility
- The scenarios in this guide are educational examples, not financial advice and not a promise of profit.
- WatchlistTop can help structure market analysis, but every concrete trading decision is made by the trader.
- The trader is responsible for position size, leverage, stop placement, exchange risk, liquidation risk, and the consequences of each trade.
- Crypto assets and futures are high-risk markets. A strategy can produce losses even when all screener conditions look valid.
Market
Spot and futures. Futures add OI confirmation after the breakout.
Timeframes
- Levels: 1h, 4h, and 1d are usually more meaningful than very small timeframes.
- Entry: 5m or 15m after breakout, retest, or acceleration.
- Risk context: check 1h before entering from 5m.
Screener tools
- Automatic levels and trend lines on the chart.
- Distance-to-level columns in the list.
- Level/ray alerts so the setup is noticed before the breakout candle is finished.
- "V24", relative volume, "TA", "TR", and OI to confirm that the breakout is active.
- Large orders and orderbook imbalance to see whether liquidity blocks the breakout.
Basic setup
- Enable levels and trends for higher timeframes.
- Enable distance columns and sort by the closest instruments when preparing a breakout watchlist.
- Create level alerts for important horizontal levels and trend lines.
- In OI settings, use Change mode and compare the current value with 1h or 12h ago.
How to read the setup
- A clean breakout is stronger when the candle closes beyond the level and activity rises at the same time.
- A retest after breakout can give a better risk distance than entering on the first impulse candle.
- OI rising after breakout means new futures risk is entering the move; OI falling can mean the move is driven by position closing.
When to skip
- The breakout candle is large, but no volume or trade activity appears.
- The breakout runs directly into the next higher-timeframe level.
- The orderbook shows a large opposite-side wall very close to the breakout price.
Risk management
- For breakout entries, risk should usually be measured from the entry to the failed-breakout area or retest low/high.
- If the first breakout candle is too large, reduce size or wait for a retest.
- Do not keep the same stop distance for every coin: use the actual level structure and volatility.
Screenshots
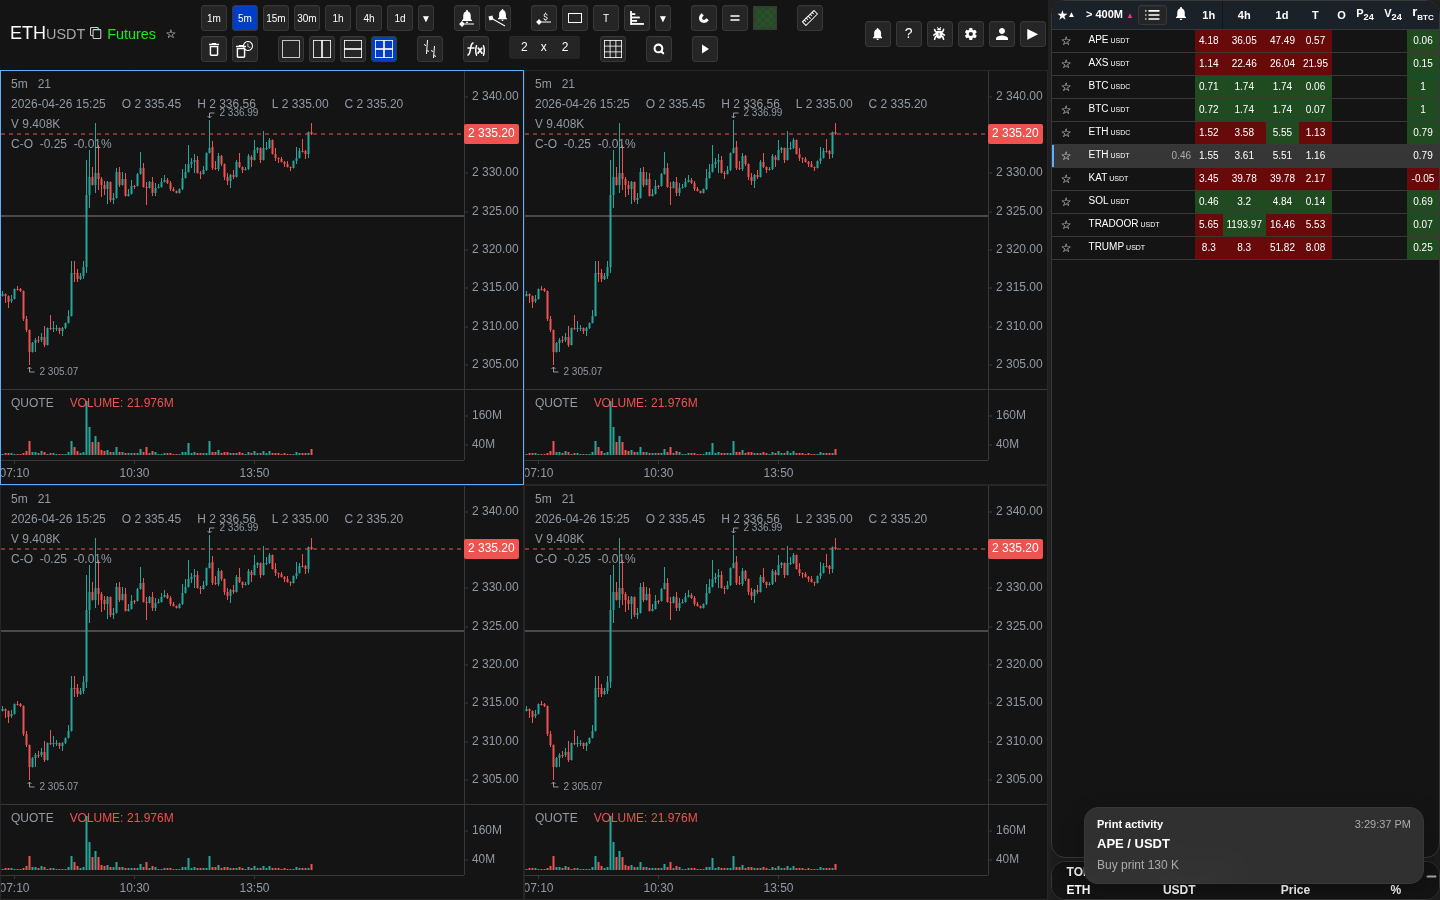
Distance to level
The list value should be checked against the level line on the chart.
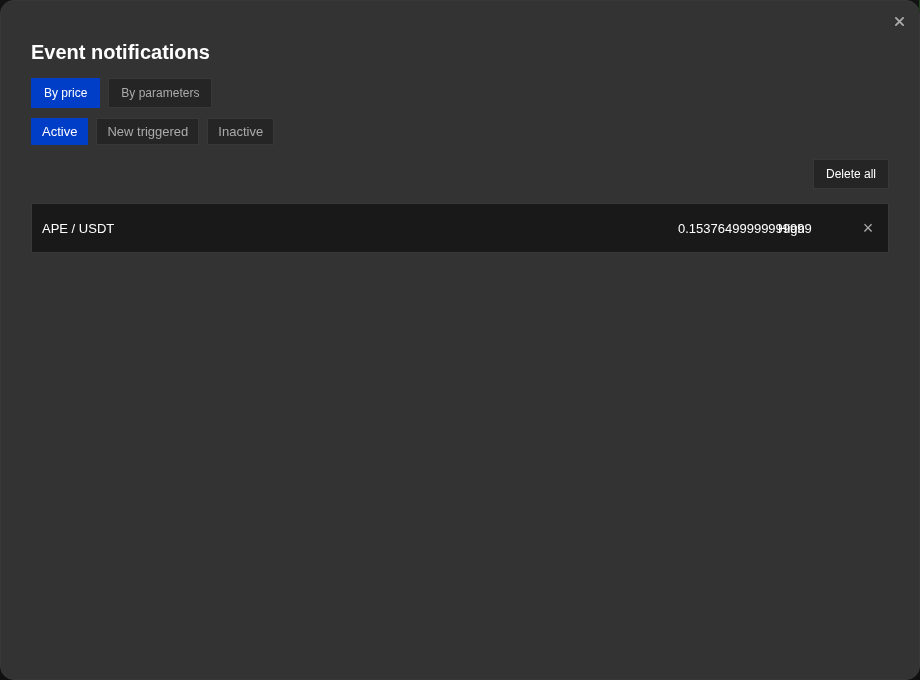
Level alert
Level alerts help prepare before the breakout happens.